
We published an update on this Danger Zone pick on August 10, 2022. A copy of the associated report is here.
We counsel investors not to try and catch falling knives – stocks that have seen steep declines but still have further to fall. As the market rotates away from high-flying growth names to more stable cash generators, investors need reliable fundamental research, more than ever, to protect their portfolios from falling knives.
We continue to post an exceptional hit rate on spotting overvalued stocks. Currently, 62 out of our 65 Danger Zone stock picks are down from their 52-week highs by more than the S&P 500. Figure 1 lists the open Danger Zone picks that are down at least 40% from their 52-week highs. Our Focus List Stocks: Short Model Portfolio, the best-of-the-best of our Danger Zone picks, outperformed the S&P 500 as a short portfolio by 36% in 2021 with 29 out of our 31 picks outperforming the index.
This report highlights one particularly dangerous falling knife: Shake Shack (SHAK: $64/share). We highlight four other falling knives in other reports published today: Allbirds (BIRD: $12/share) here, Sweetgreen (SG: $31/share) here, Carvana (CVNA: $150/share) here, and Wayfair (W: $140/share) here. Each of these stocks have dropped at least 40% from all-time highs, yet still carry at least 40% additional downside risk.
Figure 1: Danger Zone Picks Down >40% From 52-Week High – Performance through 2/4/22
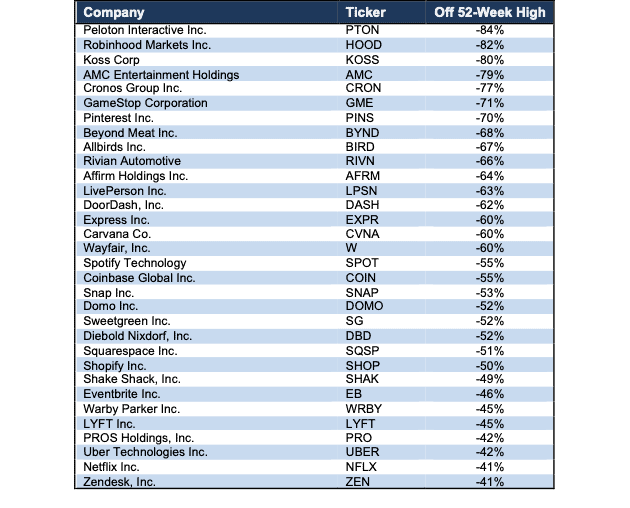
Sources: New Constructs, LLC
Falling Knife: Shake Shack (SHAK): Down 52% from 52-Wk High & 80%+ Downside Remaining
We put Shake Shack (SHAK) in the Danger Zone in June 2019 and reiterated our opinion on the stock in August 2021. Since the original report, the stock has outperformed the S&P 500 as a short by 57% and the stock could fall another 80%. We detail Shake Shack’s lagging profitability, strong competition, and lack of meaningful differentiation in our most recent report here.
Shake Shack Priced to Surpass Bigger & More Profitable Industry Peers
Below, we use our reverse DCF model to analyze the expectations for future growth in cash flows baked into Shake Shack’s current share price and show that it could fall 80%+ further.
To justify its current price of $64/share, Shake Shack must:
- improve its NOPAT margin to 11% (equal to Chipotle’s TTM margin and well above Shake Shack’s 0.7% TTM margin or 6% pre-pandemic 2019 margin), and
- grow revenue by 24% compounded annually through 2027 (3x projected industry growth through 2025).
In this scenario, Shake Shack would generate $2.3 billion in revenue in 2027, which is 3x its TTM revenue and over 4x its pre-pandemic 2019 revenue. At $2.3 billion, Shake Shack’s revenue would more than double industry peer Red Robin Gourmet Burgers (RRGB) and be 85% of the Cheesecake Factory’s (CAKE) TTM revenue.
We think it’s overly optimistic to assume Shake Shack will reverse years of margin deterioration while also growing revenue three times as fast as the overall industry. In a more realistic scenario, detailed below, the stock has large downside risk.
63%+ Downside if Consensus is Right
We review an additional DCF scenario to highlight the downside risk if Shake Shack’s revenue grows more in-line with consensus estimates and the firm can re-achieve its pre-pandemic margins.
If we assume Shake Shack’s:
- NOPAT margin improves to 6% (equal to pre-pandemic 2019 level),
- revenue grows at consensus rates in 2021 2022, and 2023, and
- revenue grows 16% a year in 2024-2027 (double industry growth rate through 2025), then
the stock is worth $24/share today – a 63% downside to the current price. This scenario still implies Shake Shack’s NOPAT quadruples from 2019 levels (highest in company history).
If Shake Shack fails to improve margins (likely given that labor costs are expected to weigh on profitability) or grow revenue at consensus rates, the downside risk in the stock is even higher.
80%+ Downside If Revenue Growth Slows to Industry Expectations
We review a third DCF scenario to highlight the downside risk if Shake Shack’s revenue growth slows to equal the overall fast casual industry growth rate beyond 2023.
If we assume Shake Shack’s:
- NOPAT margin improves to 6%,
- revenue grows at consensus rates in 2021, 2022, and 2023, and
- revenue grows 8% a year from 2024-2027 (equal to projected industry CAGR through 2025), then
the stock is worth $13/share today – an 80% downside to the current price.
Figure 2 compares Shake Shack’s implied future NOPAT in these three scenarios to its historical NOPAT. For reference, we include the TTM NOPAT of peers Texas Roadhouse (TXRH) and Cheesecake Factory.
Figure 2: Shake Shack’s Historical and Implied NOPAT: DCF Valuation Scenarios
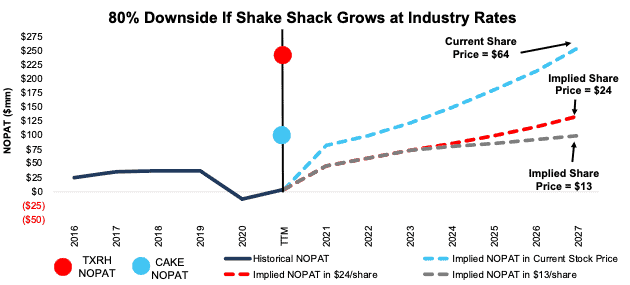
Sources: New Constructs, LLC and company filings.
Each of the above scenarios assumes Shake Shack’s YoY change in invested capital is 9% of revenue in each year of our DCF model, given the firm’s expansion plans. Such an estimate could prove conservative but allows us to create best-case scenarios that demonstrate how high expectations embedded in the current valuation are For context, Shake Shack’s invested capital averaged 22% of revenue from 2016-TTM and invested capital has grown 21% compounded annually since 2016.
Fundamental Research Provides Clarity in Frothy Markets
2022 has quickly shown investors that fundamentals matter and stocks don’t only go up. With a better grasp on fundamentals, investors have a better sense of what and when to buy and sell – and – know how much risk they take when they own a stock at certain levels. Without reliable fundamental research, investors have no reliable way of knowing whether a stock is expensive or cheap.
As shown above, disciplined, reliable fundamental research shows that even after plummeting, Allbirds, Sweetgreen, Carvana, Wayfair, and Shake Shack still hold significant downside.
This article originally published on February 7, 2022.
Disclosure: David Trainer, Kyle Guske II, and Matt Shuler receive no compensation to write about any specific stock, style, or theme.
Follow us on Twitter, Facebook, LinkedIn, and StockTwits for real-time alerts on all our research.