
The All Cap Growth style ranks fifth out of the twelve fund styles as detailed in my Style Rankings for ETFs and Mutual Funds report. It gets my Neutral rating, which is based on aggregation of ratings of both ETFs and 449 mutual funds in the All Cap Growth style as of July 16, 2013. Prior reports on the best & worst ETFs and mutual funds in every sector and style are here.
Figure 1 ranks from best to worst the two all-cap growth ETFs and Figure 2 shows the five best and worst-rated all-cap growth mutual funds. Not all All Cap Growth style ETFs and mutual funds are created the same. The number of holdings varies widely (from 17 to 1995), which creates drastically different investment implications and ratings. The best ETFs and mutual funds allocate more value to Attractive-or-better-rated stocks than the worst, which allocate too much value to Neutral-or-worse-rated stocks.
To identify the best and avoid the worst ETFs and mutual funds within the All Cap Growth style, investors need a predictive rating based on (1) stocks ratings of the holdings and (2) the all-in expenses of each ETF and mutual fund. Investors need not rely on backward-looking ratings. My fund rating methodology is detailed here.
Investors should not buy any All Cap Growth ETFs or mutual funds because none get an Attractive-or-better rating. If you must have exposure to this style, you should buy a basket of Attractive-or-better rated stocks and avoid paying undeserved fund fees. Active management has a long history of not paying off.
Get my ratings on all ETFs and mutual funds in this style on my free mutual fund and ETF screener.
Figure 1: ETFs with the Best & Worst Ratings – Top 5
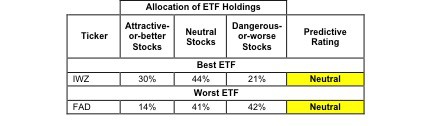
* Best ETFs exclude ETFs with TNAs less than $100 million for inadequate liquidity.
Sources: New Constructs, LLC and company filings
Figure 2: Mutual Funds with the Best & Worst Ratings – Top 5
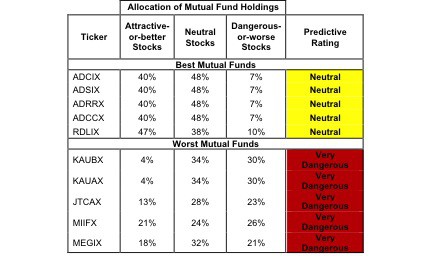
* Best mutual funds exclude funds with TNAs less than $100 million for inadequate liquidity.
Sources: New Constructs, LLC and company filings
Advisors Series Trust Scharf Fund (LOGIX) is excluded from Figure 2 because its total net assets (TNA) are below $100 million and do not meet our liquidity standards.
iShares Russell 3000 Growth ETF (IWZ) is my top-rated All Cap Growth ETF and American Century Quantitative Equity Disciplined Growth Fund (ADCIX) is my top-rated All Cap Growth mutual fund. Both earn my Neutral rating.
First Trust Multi Cap Growth AlphaDEX Fund (FAD) is my worst-rated All Cap Growth ETF and U.S. Global Investors MegaTrends Fund (MEGIX) is my worst-rated All Cap Growth mutual fund. FAD earns my Neutral rating, while MEGIX gets my Very Dangerous rating.
Figure 3 shows that 330 out of the 2121 stocks (over 23% of the market value) in All Cap Growth ETFs and mutual funds get an Attractive-or-better rating. However, neither of the two All Cap Growth ETFs and 1 out of 449 All Cap Growth mutual funds (less than 1% of total net assets) get an Attractive-or-better rating.
The takeaways are: mutual fund managers allocate too much capital to low-quality stocks and All Cap Growth ETFs hold poor quality stocks.
Figure 3: All Cap Growth Style Landscape For ETFs, Mutual Funds & Stocks
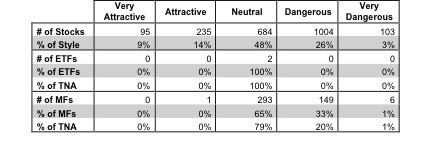
Sources: New Constructs, LLC and company filings
As detailed in “Low-Cost Funds Dupe Investors”, the fund industry offers many cheap funds but very few funds with high-quality stocks, or with what I call good portfolio management.
Investors need to tread carefully when considering All Cap Growth ETFs and mutual funds, as no ETFs or mutual funds with over $100 million in assets earn my Attractive rating. No ETFs and one mutual fund (with under $100 million in assets) in the All Cap Growth style allocate enough value to Attractive-or-better-rated stocks to earn an Attractive rating.
United Parcel Service (UPS) is one of my favorite stocks held by All Cap Growth ETFs and mutual funds and earns my Very Attractive rating. UPS has grown profits (NOPAT) by over 10% compounded annually since my model begins, from $2.1 billion in 1999 to $7.5 billion in 2012. UPS also has a return on invested capital (ROIC) of 23%, which puts it in the top quintile of all the companies I cover. Despite this growth and efficiency over the past decade or so, UPS still trades at ~$86/share, giving it a price to economic book value of 0.8. This value implies that the market expects UPS’ profits to permanently decline by 20%. The market’s expectations are awfully low for a company with the track record and competitive position of UPS. Investors should buy UPS while it trades at such a discount.
Hologic Inc. (HOLX) is one of my least favorite stocks held by All Cap Growth ETFs and mutual funds and earns my Dangerous rating. While HOLX has grown revenues and profits since 1998, the past 4 years have seen its profits (NOPAT) decline by 12% compounded annually. Hologic’s return on invested capital (ROIC) of 2% in 2012 is down from 15% in 2005 and currently in the bottom quintile of all companies I cover. I warned of this decline in economic earnings in mid September 2012. With declining profits and ROICs, the stock’s current valuation should give investors pause. To justify HOLX’s current price of ~$20/share, the company must grow profits over 20% compounded annually for the next 12 years. That is a tall order for any company especially one that has seen profits decline at 12% compounded annually over the past 4 years. Investors should avoid HOLX.
Figures 4 and 5 show the rating landscape of all All Cap Growth ETFs and mutual funds.
My Style Rankings for ETFs and Mutual Funds report ranks all styles and highlights those that offer the best investments.
Figure 4: Separating the Best ETFs From the Worst Funds
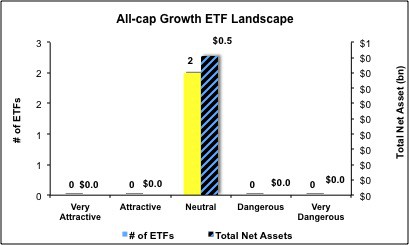
Sources: New Constructs, LLC and company filings
Figure 5: Separating the Best Mutual Funds From the Worst Funds
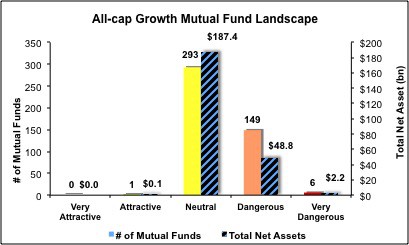
Sources: New Constructs, LLC and company filings
Review my full list of ratings and rankings along with reports on all 2 ETFs and 449 mutual funds in the All Cap Growth style.
André Rouillard contributed to this report.
Disclosure: David Trainer and André Rouillard receive no compensation to write about any specific stock, sector, style or theme.