
The Mid Cap Blend style ranks seventh out of the twelve fund styles as detailed in my Style Rankings for ETFs and Mutual Funds report. It gets my Dangerous rating, which is based on aggregation of ratings of 16 ETFs and 324 mutual funds in the Mid Cap Blend style as of October 18, 2013. Prior reports on the best & worst ETFs and mutual funds in every sector and style are here.
Figures 1 and 2 show the five best and worst-rated ETFs and mutual funds in the style. Not all Mid Cap Blend style ETFs and mutual funds are created the same. The number of holdings varies widely (from 24 to 3067). This variation creates drastically different investment implications and, therefore, ratings. The best ETFs and mutual funds allocate more value to Attractive-or-better-rated stocks than the worst, which allocate too much value to Neutral-or-worse-rated stocks.
To identify the best and avoid the worst ETFs and mutual funds within the Mid Cap Blend style, investors need a predictive rating based on (1) stocks ratings of the holdings and (2) the all-in expenses of each ETF and mutual fund. Investors need not rely on backward-looking ratings. My fund rating methodology is detailed here.
Investors should not buy any Mid Cap Blend ETFs or mutual funds because none get an Attractive-or-better rating. If you must have exposure to this style, you should buy a basket of Attractive-or-better rated stocks and avoid paying undeserved fund fees. Active management has a long history of not paying off. Here’s the list of our top-rated Mid Cap Blend stocks.
Get my ratings on all ETFs and mutual funds in this style by searching for Mid Cap Blend on my free mutual fund and ETF screener.
Figure 1: ETFs with the Best & Worst Ratings – Top 5
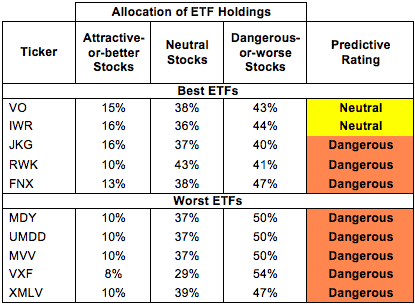 * Best ETFs exclude ETFs with TNAs less than $100 million for inadequate liquidity.
Sources: New Constructs, LLC and company filings
Guggenheim Mid Cap Core ETF (CZA), PowerShares RAFI Fundamental Pure Mid Core Portfolio (PXMC), and Guggenheim Russell Mid Cap Equal Weight ETF (EWRM) are excluded from Figure 1 because their total net assets (TNA) are each below $100 million and do not meet our liquidity minimums.
Figure 2: Mutual Funds with the Best & Worst Ratings – Top 5
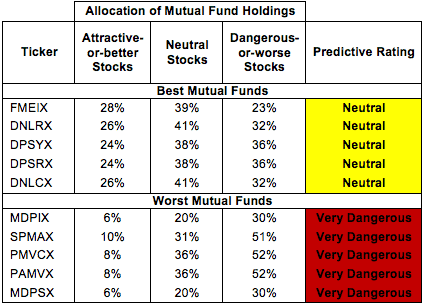 * Best mutual funds exclude funds with TNAs less than $100 million for inadequate liquidity.
Sources: New Constructs, LLC and company filings
Royce SMid Cap Value Fund (RMVSX), Boston Trust Mid Cap Fund (BTMFX), and Stewart Capital Mid Cap Fund (SCMFX) are excluded from Figure 2 because their total net assets (TNA) are each below $100 million and do not meet our liquidity minimums.
Vanguard Mid Cap ETF (VO) is my top-rated Mid Cap Blend ETF and Fidelity Mid Cap Enhanced Index Fund (FMEIX) is my top-rated Mid Cap Blend mutual fund. Both earn my Neutral rating.
PowerShares S&P Mid Cap Low Volatility Portfolio (XMLV) is my worst-rated Mid Cap Blend ETF and ProFunds Mid Cap ProFund (MDPSX) is my worst-rated Mid Cap Blend mutual fund. XMLV earns my Dangerous rating, while MDPSX gets my Very Dangerous rating.
Figure 3 shows that 282 out of the 2434 stocks (over 16% of the market value) in Mid Cap Blend ETFs and mutual funds get an Attractive-or-better rating. However, zero out of 16 Mid Cap Blend ETFs and zero out of 324 Mid Cap Blend mutual funds get an Attractive-or-better rating.
The takeaways are: mutual fund managers allocate too much capital to low-quality stocks and Mid Cap Blend ETFs hold poor quality stocks.
Figure 3: Mid Cap Blend Style Landscape For ETFs, Mutual Funds & Stocks
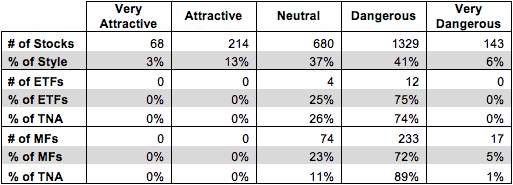 Sources: New Constructs, LLC and company filings
As detailed in “Low-Cost Funds Dupe Investors”, the fund industry offers many cheap funds but very few funds with high-quality stocks, or with what I call good portfolio management.
Investors need to tread carefully when considering Mid Cap Blend ETFs and mutual funds, as none earn above a Neutral rating. In other words, zero ETFs and zero mutual funds in the Mid Cap Blend style allocate enough value to Attractive-or-better-rated stocks to earn an Attractive rating. Investors would be better off focusing on individual Mid Cap stocks instead.
Nvidia Corp. (NVDA) is one of my favorite stocks held by Mid Cap Blend ETFs and mutual funds and earns my Very Attractive rating. NVDA has an impressive return on invested capital (ROIC) of 30%, a number it has maintained over the past 2 years. Moreover, NVDA has grown profits (NOPAT) by 36% compounded annually over the past eight years and has a current free cash flow yield of 7%. Despite sitting on $3.7 billion in cash and experiencing rapid profit growth over the past several years, NVDA is still underpriced by the market at ~$16/share. This valuation gives the company a price to economic book value (PEBV) ratio of 1.0, which implies that the market expects NVDA’s profits never to grow from their current level. With a track record of profit growth like NVDA’s and growth expected in the tablet and mobile processor market, the market’s expectations for profit stagnation look unlikely. Investors should pick up NVDA and hold on before the stock valuation adjusts.
Vertex Pharmaceuticals (VRTX) is one of my least favorite stocks held be Mid Cap Blend ETFs and mutual funds and earns my Dangerous rating. Vertex has a return on invested capital (ROIC) of just 4%, which puts it in the bottom quintile of all companies I cover. Vertex also has a free cash flow yield of -3% and has earned negative economic earnings every year since the beginning of my model. Despite this inability to generate value for investors, VRTX is overpriced at ~$77/share. To justify this stock price, VRTX would need to grow profits (NOPAT) by 18% compounded annually for the next 18 years. These expectations seem like a tall order for a company that has posted a profit only twice in the past 15 years. VRTX is too expensive and too risky for investors to justify purchasing at the moment.
Figures 4 and 5 show the rating landscape of all Mid Cap Blend ETFs and mutual funds.
My Style Rankings for ETFs and Mutual Funds report ranks all styles and highlights those that offer the best investments.
Figure 4: Separating the Best ETFs From the Worst Funds
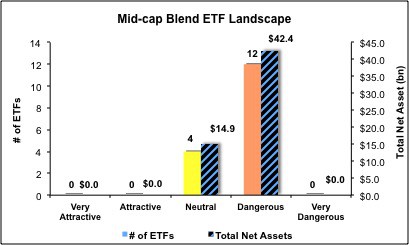 Sources: New Constructs, LLC and company filings
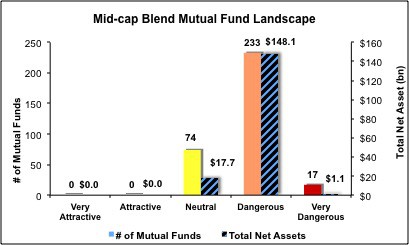
Figure 5: Separating the Best Mutual Funds From the Worst Funds
 Sources: New Constructs, LLC and company filings
Review my full list of ratings and rankings along with reports on all 16 ETFs and 324 mutual funds in the Mid Cap Blend style.
André Rouillard contributed to this report.
Disclosure: David Trainer and Andre Rouillard receive no compensation to write about any specific stock, sector, style or theme.