
The Mid Cap Value style ranks ninth out of the twelve fund styles as detailed in my Style Rankings for ETFs and Mutual Funds report. It gets my Dangerous rating, which is based on aggregation of ratings of 12 ETFs and 187 mutual funds in the Mid Cap Value style as of July 18, 2013. Prior reports on the best & worst ETFs and mutual funds in every sector and style are here.
Figures 1 and 2 show the five best and worst-rated ETFs and mutual funds in the style. Not all Mid Cap Value style ETFs and mutual funds are created the same. The number of holdings varies widely (from 29 to 2880), which creates drastically different investment implications and ratings. The best ETFs and mutual funds allocate more value to Attractive-or-better-rated stocks than the worst, which allocate too much value to Neutral-or-worse-rated stocks.
To identify the best and avoid the worst ETFs and mutual funds within the Mid Cap Value style, investors need a predictive rating based on (1) stocks ratings of the holdings and (2) the all-in expenses of each ETF and mutual fund. Investors need not rely on backward-looking ratings. My fund rating methodology is detailed here.
Investors should not buy any Mid Cap Value ETFs or mutual funds because none get an Attractive-or-better rating. If you must have exposure to this style, you should buy a basket of Attractive-or-better rated stocks and avoid paying undeserved fund fees. Active management has a long history of not paying off.
Get my ratings on all ETFs and mutual funds in this style by searching for Mid Cap Value on my free mutual fund and ETF screener.
Figure 1: ETFs with the Best & Worst Ratings – Top 5
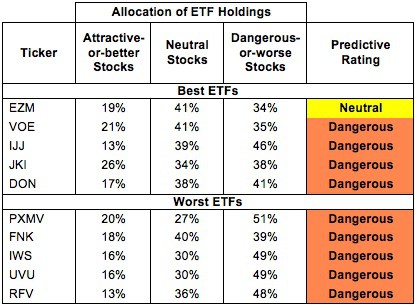 * Best ETFs exclude ETFs with TNAs less than $100 million for inadequate liquidity.
Sources: New Constructs, LLC and company filings
Vanguard S&P Mid-Cap 400 Value ETF (VOE) and SPDR S&P 400 Mid Cap Value ETF (MDYV) are excluded from Figure 1 because their total net assets (TNA) are below $100 million and do not meet our liquidity standards.
Figure 2: Mutual Funds with the Best & Worst Ratings – Top 5
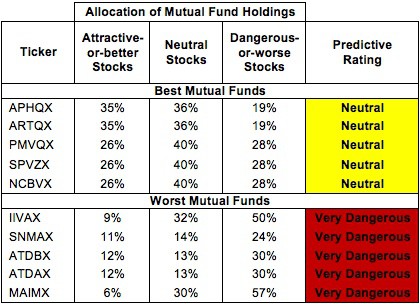 * Best mutual funds exclude funds with TNAs less than $100 million for inadequate liquidity.
Sources: New Constructs, LLC and company filings
Neuberger Berman Mid Cap Intrinsic Value Fund (NBRTX, NBREX, NBRVX, NBRRX, NBRCX) and Westcore Mid-Cap Value Dividend Fund (PMVQX) are excluded from Figure 2 because their total net assets (TNA) are below $100 million and do not meet our liquidity standards.
WisdomTree MidCap Earnings Fund (EZM) is my top-rated Mid Cap Value ETF and Artisan Mid Cap Value Fund (APHQX) is my top-rated Mid Cap Value mutual fund. Both earn my Neutral rating.
Guggenheim S&P Midcap 400 Pure Value (RFV) is my worst-rated Mid Cap Value ETF and Munder Integrity Mid-Cap Value Fund (MAIMX) is my worst-rated Mid Cap Value mutual fund. RFV earns my Dangerous rating and MAIMX earns my Very Dangerous rating
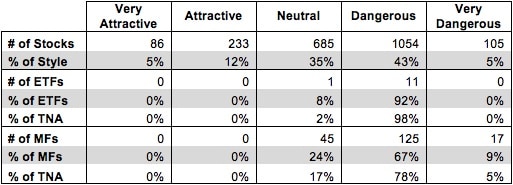
Figure 3 shows that 319 out of the 2,163 stocks (over 17% of the market value) in Mid Cap Value ETFs and mutual funds get an Attractive-or-better rating. However, no ETFs or mutual funds in the style allocate enough value to Attractive-or-better rated stocks to earn an Attractive rating.
The takeaways are: mutual fund managers allocate too much capital to low-quality stocks and Mid Cap Value ETFs hold poor quality stocks.
Figure 3: Mid Cap Value Style Landscape For ETFs, Mutual Funds & Stocks
 Sources: New Constructs, LLC and company filings
As detailed in “Low-Cost Funds Dupe Investors”, the fund industry offers many cheap funds but very few funds with high-quality stocks, or with what I call good portfolio management.
Investors need to tread carefully when considering Mid Cap Value ETFs and mutual funds, as 11 out of 12 ETFs (98% of assets) and 142 out of 187 mutual funds (83% of assets) earn a Dangerous-or-worse rating. Most Mid Cap Value funds have poor holdings and/or high costs. Investors can do better with no fees by focusing on individual stocks.
Kroger Company (KR) is one of my favorite stocks held by Mid Cap Value ETFs and mutual funds and earns my Attractive rating. KR’s recently acquisition of Harris Teeter (HTSI) looks to be a good value creator for investors. I’ve written before about how “earnings accretive” mergers can actually destroy shareholder value, but this acquisition looks good from a return on invested capital (ROIC) perspective as well. HTSI’s $180 million 2012 NOPAT divided by the $2.5 billion purchase price gives the acquisition an ROIC of 7.2%, slightly higher than its current 6.6% ROIC. This deal is so good for KR that some HTSI shareholders are even suing to try to block the sale, arguing that the price undervalues the company.
Whether or not the acquisition is completed, KR is a great value for investors. At its current valuation of ~$38/share, KR has a price to economic book value ratio of only 0.7. What this ratio means for investors is that the market’s valuation implies a permanent 30% decline in NOPAT or after-tax cash flow. KR is not a high-growth company, but there is nothing to suggest that such a significant decline in profitability is likely. KR offers investors stability, value, and potential upside from HTSI.
Southwest Airlines (LUV) is one of my least favorite stocks held by Mid Cap Value ETFs and mutual funds and earns my Very Dangerous rating. LUV, like many airlines, has seen its profitability eroding for years. LUV’s ROIC stands at a paltry 3.8%, down from 9.8% back in 2000. LUV also faces short-term pressure due to labor union issues, as 83% of its employees are represented by unions. For comparison, Delta Air Lines (DAL) has only 15% of its employees unionized. Currently, 8 out of the 19 collective bargaining agreements covering LUV employees are under negotiation. LUV’s ground operators made news in May by picketing to protest the possible outsourcing of their jobs. LUV’s financial situation is shaky enough as it is. It cannot afford major labor troubles at this point.
Unfortunately, even a favorable outcome to its labor negotiations would not be nearly enough to make LUV an appealing prospect for investors. To justify its ~$14/share valuation, LUV would need to grow NOPAT by 11% compounded annually for 10 years. Given LUV’s track record and the competitive nature of the airline business, such growth seems unlikely. At its current price, LUV offers investors significant risk with very little upside.
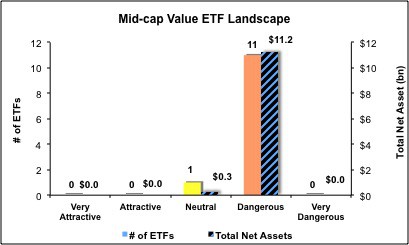
Figures 4 and 5 show the rating landscape of all Mid Cap Value ETFs and mutual funds.
My Style Rankings for ETFs and Mutual Funds report ranks all styles and highlights those that offer the best investments.
Figure 4: Separating the Best ETFs From the Worst Funds
 Sources: New Constructs, LLC and company filings
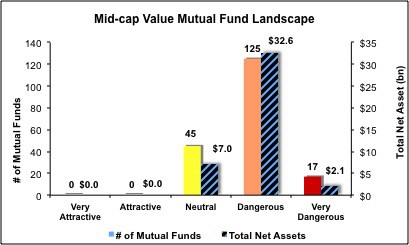
Figure 5: Separating the Best Mutual Funds From the Worst Funds
 Sources: New Constructs, LLC and company filings
Review my full list of ratings and rankings along with reports on all 12 ETFs and 187 mutual funds in the Mid Cap Value style.
Sam McBride contributed to this report.
Disclosure: David Trainer and Sam McBride receive no compensation to write about any specific stock, sector, or theme.