
The Energy sector ranks fifth out of the ten sectors as detailed in my Sector Rankings for ETFs and Mutual Funds report. It gets my Neutral rating, which is based on aggregation of ratings of 20 ETFs and 73 mutual funds in the Energy sector as of January 25th, 2013. Prior reports on the best & worst ETFs and mutual funds in every sector and style are here.
Figures 1 and 2 show the five best and worst-rated ETFs and mutual funds in the sector. Not all Energy sector ETFs and mutual funds are created the same. The number of holdings varies widely (from 23 to 167), which creates drastically different investment implications and ratings. The best ETFs and mutual funds allocate more value to Attractive-or-better-rated stocks than the worst ETFs and mutual funds, which allocate too much value to Neutral-or-worse-rated stocks.
To identify the best and avoid the worst ETFs and mutual funds within the Energy sector, investors need a predictive rating based on (1) stocks ratings of the holdings and (2) the all-in expenses of each ETF and mutual fund. Investors need not rely on backward-looking ratings. My fund rating methodology is detailed here.
Investors should not buy any Energy ETFs or mutual funds because none get an Attractive-or-better rating. If you must have exposure to this sector, you should buy a basket of Attractive-or-better rated stocks and avoid paying undeserved fund fees. Active management has a long history of not paying off.
Get my ratings on all ETFs and mutual funds in this sector on my free mutual fund and ETF screener.
Figure 1: ETFs with the Best & Worst Ratings – Top 5
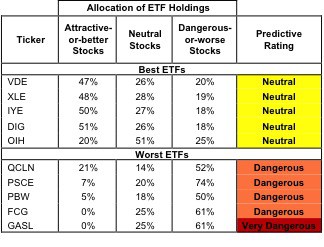 * Best ETFs exclude ETFs with TNAs less than $100 million for inadequate liquidity.
Sources: New Constructs, LLC and company filings
Figure 2: Mutual Funds with the Best & Worst Ratings – Top 5
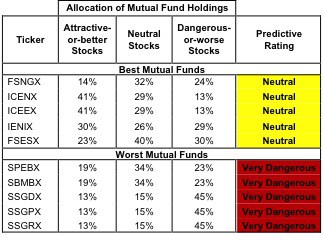 * Best mutual funds exclude funds with TNAs less than $100 million for inadequate liquidity.
Sources: New Constructs, LLC and company filings
ING Mutual Funds: ING Global Natural Resources Fund (IRGNX, IGNWX) and Advisors’ Inner Circle Fund II: Frost Natural Resources Fund (FNRFX) are excluded from Figure 2 because their total net assets (TNA) are below $100 million and do not meet our liquidity standards.
Vanguard Energy ETF (VDE) is my top-rated Energy ETF and Fidelity Select Portfolios: Natural Gas Portfolio (FSNGX) is my top-rated Energy mutual fund. Both earn my Neutral rating.
Direxion Daily Natural Gas Related Bull 3x Shares (GASL) is my worst-rated Energy ETF and BlackRock Funds: BlackRock Energy & Resources Portfolio (SSGRX) is my worst-rated Energy mutual fund. Both earn my Very Dangerous rating.
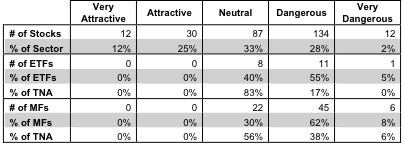
Figure 3 shows that 42 out of the 275 stocks (over 37% of the total net assets) held by Energy ETFs and mutual funds get an Attractive-or-better rating. However, none of the 20 ETFs and none of the 73 mutual funds in the Energy sector get an Attractive-or-better rating.
The takeaways are: mutual fund managers allocate too much capital to low-quality stocks and Energy ETFs hold poor quality stocks.
Figure 3: Energy Sector Landscape For ETFs, Mutual Funds & Stocks
 Sources: New Constructs, LLC and company filings
It is quite unfortunate that ETF and mutual fund providers do not offer investors a single Attractive-or-better-rated fund especially when over 32% of the stocks get an Attractive-or-better rating.
Investors need to tread carefully when considering energy ETFs and mutual funds. No ETFs or mutual funds in the sector allocate enough value to Attractive-or-better-rated stocks to earn an Attractive-or-better rating. Focus on individual stocks instead.
As detailed in “Cheap Funds Dupe Investors”, the fund industry offers many cheap funds but very few funds with high-quality stocks, or with what I call good portfolio management.
VDE’s rating is helped immensely by its 21% allocation to Exxon Mobil Corp (XOM). Exxon is one of my favorite stocks held by Energy ETFs and mutual funds and earns my Very Attractive rating. Exxon recently passed Apple, Inc. (AAPL) as the world’s most valuable company, but unlike Apple, Exxon looks like a good bet to keep rewarding investors. It’s grown its economic earnings at an impressive CAGR of 43% for the last four years, and it’s still seriously undervalued at $91/share. That price results in a price to economic book value ratio of 0.6, which mean the market expects XOM’s NOPAT to decline by 40% permanently.
Cabot Oil & Gas Corp. (COG) is one of my least favorite stocks held by Energy ETFs and mutual funds and earns my Very Dangerous rating. COG was in the Danger Zone a few weeks ago, and nothing has changed since then. Deferred tax liabilities, off-balance sheet debt, and asset write-downs result in a bloated balance of which most investors are not aware. This bloating means the company continues to show positive GAAP earnings when economic earnings are not truly there. COG would need to grow NOPAT by 20% compounded annually for 20 years to justify its current share price of ~$52.00. Those expectations are way too high for a company that’s destroying, rather than creating, value.
180 stocks of the 3000+ I cover are classified as Energy stocks, but due to style drift, Energy ETFs and mutual funds hold 275 stocks.
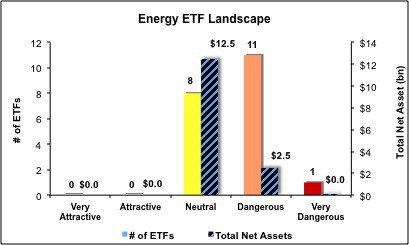
Figures 4 and 5 show the rating landscape of all Energy ETFs and mutual funds.
Our Sector Rankings for ETFs and Mutual Funds report ranks all sectors and highlights those that offer the best investments.
Figure 4: Separating the Best ETFs From the Worst ETFs
 Sources: New Constructs, LLC and company filings
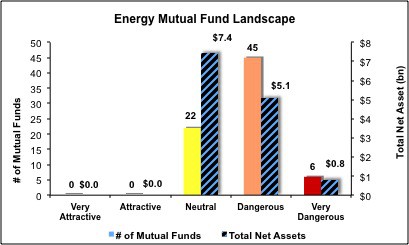
Figure 5: Separating the Best Mutual Funds From the Worst Mutual Funds
 Sources: New Constructs, LLC and company filings
Review my full list of ratings and rankings along with reports on all 20 ETFs and 73 mutual funds in the Energy sector.
Sam McBride contributed to this report.
Disclosure: David Trainer owns XOM. David Trainer and Sam McBride receive no compensation to write about any specific stock, sector or theme.