The Industrials sector ranks fourth out of the ten sectors as detailed in my sector rankings for ETFs and mutual funds. It gets my Neutral rating, which is based on an aggregation of the ratings of 16 ETFs and 18 mutual funds in the Industrials sector as of October 9, 2012. Prior reports on the best & worst ETFs and mutual funds in every sector and style are here.
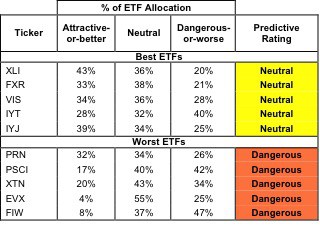
Figures 1 and 2 show the five best and worst-rated ETFs and mutual funds in the sector. Not all Industrials sector ETFs and mutual funds are created the same. The number of holdings varies widely (from 20 to 368), which creates drastically different investment implications and ratings. The best ETFs and mutual funds allocate more value to Attractive-or-better-rated stocks than the worst ETFs and mutual funds, which allocate too much value to Neutral-or-worse-rated stocks.
To identify the best and avoid the worst ETFs and mutual funds within the Industrials sector, investors need a predictive rating based on (1) stocks ratings of the holdings and (2) the all-in expenses of each ETF and mutual fund. Investors need not rely on backward-looking ratings. My fund rating methodology is detailed here.
Investors should not buy any Industrials ETFs or mutual funds because none get an Attractive-or-better rating. If you must have exposure to this sector, you should buy a basket of Attractive-or-better rated stocks and avoid paying undeserved fund fees. Active management has a long history of not paying off.
See ratings and reports on all ETFs and mutual funds in this sector on my free mutual fund and ETF screener.
Figure 1: ETFs with the Best & Worst Ratings – Top 5
Sources: New Constructs, LLC and company filings
Four ETFs are excluded from Figure 1 because their total net assets (TNA) are below $100 million and do not meet our liquidity standards.
Figure 2: Mutual Funds with the Best & Worst Ratings – Top 5
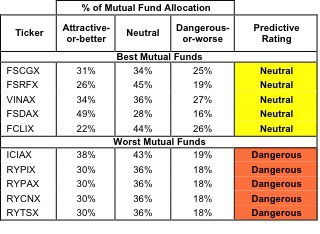
Sources: New Constructs, LLC and company filings
Two ICON Funds: ICON Industrials Funds (ICTRX and ICICX) are excluded from Figure 2 because its total net assets (TNA) are below $100 million and do not meet our liquidity standards.
Industrial Select Sector SPDR (XLI) is my top-rated Industrials ETF and Fidelity Select Portfolios: Industrial Equipment Portfolio (FSCGX) is my top-rated Industrials mutual fund. Both earn my Neutral rating.
First Trust ISE Water Index Fund (FIW) is my worst-rated Industrials ETF and Rydex Series Funds: Transportation Fund (RYTSX) is my worst-rated Industrials mutual fund. Both earn my Dangerous rating.
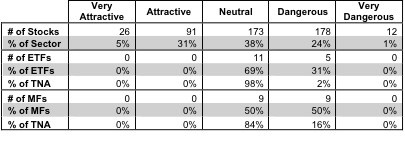
Figure 3 shows that 117 out of the 480 stocks (over 36% of the total net assets) held by Industrials ETFs and mutual funds get an Attractive-or-better rating. Despite the existence of Attractive-or-better Industrials stocks, there is not a single Industrials ETF or mutual fund that earns an Attractive-or-better rating. The majority of the total net assets of Industrials ETFs and mutual funds is allocated to Neutral-or-worse-rated stocks.
The takeaway is: mutual fund managers allocate too much capital to low-quality stocks and Industrials ETFs hold poor quality stocks.
Figure 3: Industrials Sector Landscape For ETFs, Mutual Funds & Stocks
As detailed in “Cheap Funds Dupe Investors”, the fund industry offers many cheap funds but very few funds with high-quality stocks, or with what I call good portfolio management.
Investors should avoid all Industrials ETFs and mutual funds. Instead of paying fees to own a portfolio of unattractive stocks, investors who desire exposure to the Industrials sector should focus on owning a basket of stocks that earn an Attractive-or-better rating.
United Technologies (UTX) is one of my favorite stocks held by Industrials ETFs and mutual funds and earns my Attractive rating. UTX is an impressively profitable company, turning in returns on invested capital (ROIC) that consistently exceed 12%. ROIC is the primary driver of shareholder value creation and it is essential for management to keep ROIC above the weighted average cost of capital (WACC). The Industrials sector is typically capital intensive and many companies struggle to maintain returns on invested capital above WACC. In fact, the median ROIC in 2011 for the 421 Industrials was 7.4%. UTX earned an ROIC of 12.7%, placing UTX in the top quintile of all Industrials. The company is profitable and efficient, but a great company is not always a great stock to buy. UTX earns an Attractive rating because it’s a great company with a cheap stock price. The market has low expectations for the future performance of UTX at $77.33 as of 10/19/12. The current valuation implies that the company’s profits will decline permanently by 7%. For a company that has seen consistent growth in profitability, those expectations seem too pessimistic. From Otis Elevators to Pratt & Whitney aircraft engines, United Technologies manufactures products that are made for going up. I would expect the stock price to go up as well as the market’s expectations align with UTX’s profitable performance.
Simpson Manufacturing Co (SSD) is one of my least favorite stocks held by Industrials ETFs and mutual funds and earns my Very Dangerous rating. The primary reason SSD earns a Very Dangerous rating is that SSD’s Net Income over the past few years shows a misleading trend. SSD’s Net Income has been growing, but its economic earnings have been declining. A steady decline in the company’s NOPAT from its 2006 high of $107.43 million to only $39.34 million in fiscal year 2011 is not exactly a promising trend. In fact, SSD’s economic earnings margin has been negative every year since 2008 though the company has not reported an accounting earnings loss. Rising accounting earnings is a dangerous sign when the true economic earnings are steadily deteriorating. Worst of all, to justify its current valuation at $28.59 as of10/9/12, the company must achieve profit growth of 15% compounded annually for the next 16 years. Those are lofty expectations for a company whose profits have declined markedly over the past five years.
421 stocks of the 3000+ I cover are classified as Industrials stocks, but due to style drift, Industrials ETFs and mutual funds hold 480 stocks.
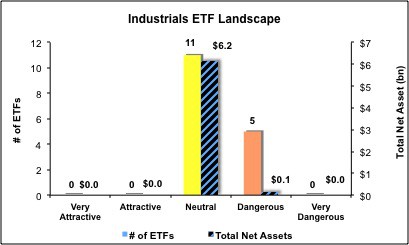
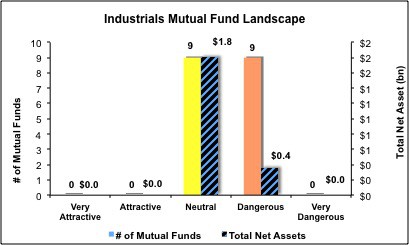
Figures 4 and 5 show the rating landscape of all Industrials ETFs and mutual funds.
Our Sector Rankings for ETFs and Mutual Funds report ranks all sectors and highlights those that offer the best investments.
Figure 4: Separating the Best ETFs From the Worst ETFs
Figure 5: Separating the Best Mutual Funds From the Worst Mutual Funds
Review my full list of ratings and rankings along with reports on all 16 ETFs and 18 mutual funds in the Industrials sector.
Disclosure: I receive no compensation to write about any specific stock, sector or theme.
