
The Industrials sector ranks fourth out of the ten sectors as detailed in my Sector Rankings for ETFs and Mutual Funds report. It gets my Neutral rating, which is based on aggregation of ratings of 16 ETFs and 18 mutual funds in the Industrials sector as of October 8, 2013. Prior reports on the best & worst ETFs and mutual funds in every sector are here.
Figures 1 and 2 show the five best and worst-rated ETFs and mutual funds in the sector. Not all Industrials sector ETFs and mutual funds are created the same. The number of holdings varies widely (from 20 to 348), which creates drastically different investment implications and ratings. The best ETFs and mutual funds allocate more value to Attractive-or-better-rated stocks than the worst ETFs and mutual funds, which allocate too much value to Neutral-or-worse-rated stocks.
To identify the best and avoid the worst ETFs and mutual funds within the Industrials sector, investors need a predictive rating based on (1) stocks ratings of the holdings and (2) the all-in expenses of each ETF and mutual fund. Investors need not rely on backward-looking ratings. My fund rating methodology is detailed here. Here’s the list of our top-rated Industrial Sector stocks.
Investors should not buy any Industrials ETFs or mutual funds because none get an Attractive-or-better rating. If you must have exposure to this sector, you should buy a basket of Attractive-or-better rated stocks and avoid paying undeserved fund fees. Active management has a long history of not paying off.
Get my ratings on all ETFs and mutual funds in this sector on my free mutual fund and ETF screener.
Figure 1: ETFs with the Best & Worst Ratings – Top 5
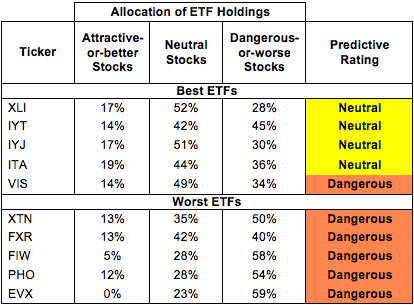 * Best ETFs exclude ETFs with TNAs less than $100 million for inadequate liquidity.
Sources: New Constructs, LLC and company filings
Four ETFs are excluded from Figure 1 because their total net assets (TNA) are below $100 million and do not meet our liquidity minimums.
Figure 2: Mutual Funds with the Best & Worst Ratings – Top 5
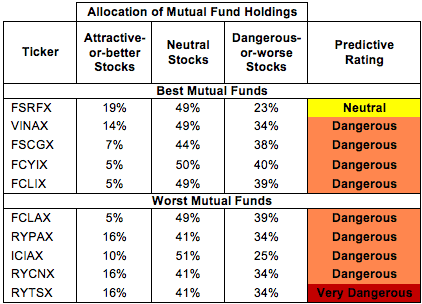 * Best mutual funds exclude funds with TNAs less than $100 million for inadequate liquidity.
Sources: New Constructs, LLC and company filings
ICON Funds: ICON Industrials Fund (ICTRX, ICICX) is excluded from Figure 2 because its total net assets (TNA) are below $100 million and do not meet our liquidity minimums.
State Street Industrial Select Sector SPDR (XLI) is my top-rated Industrials ETF and Fidelity Select Portfolios: Transportation Portfolio (FSRFX) is my top-rated Industrials mutual fund. Both earn my Neutral rating.
Market Vectors Environmental Services ETF (EVX) is my worst-rated Industrials ETF and Rydex Series Funds: Transportation Fund (RYTSX) is my worst-rated Industrials mutual fund. EVX earns my Dangerous rating and RYTSX earns my Very Dangerous rating.
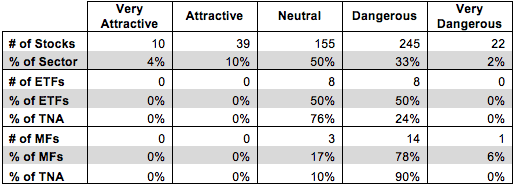
Figure 3 shows that 49 out of the 471 stocks (over 14% of the market value) in Industrials ETFs and mutual funds get an Attractive-or-better rating. However, no ETFs or mutual funds in the sector earn an Attractive rating.
The takeaways are/is: mutual fund managers allocate too much capital to low-quality stocks and Industrials ETFs hold poor quality stocks.
Figure 3: Industrials Sector Landscape For ETFs, Mutual Funds & Stocks
 Sources: New Constructs, LLC and company filings
As detailed in “Cheap Funds Dupe Investors”, the fund industry offers many cheap funds but very few funds with high-quality stocks, or with what I call good portfolio management.
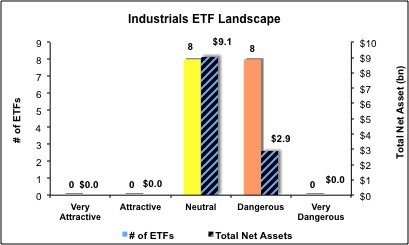
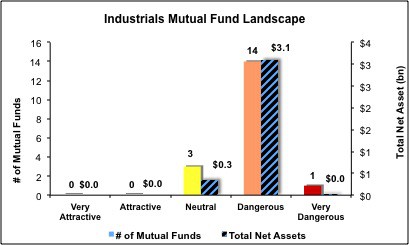
Investors need to tread carefully when considering Industrials ETFs and mutual funds, as most of them are Dangerous. Eight out of 16 Industrials ETFs and 15 out 18 Industrials mutual funds earn a Dangerous-or-worse rating. 76% of the assets in Industrials ETFs are concentrated in Neutral-rated ETFs, which at least suggests that investors are identifying the higher-quality funds in the sector. Still, investors should not settle for Neutral. Focus on the Attractive individual stocks in the sector instead.
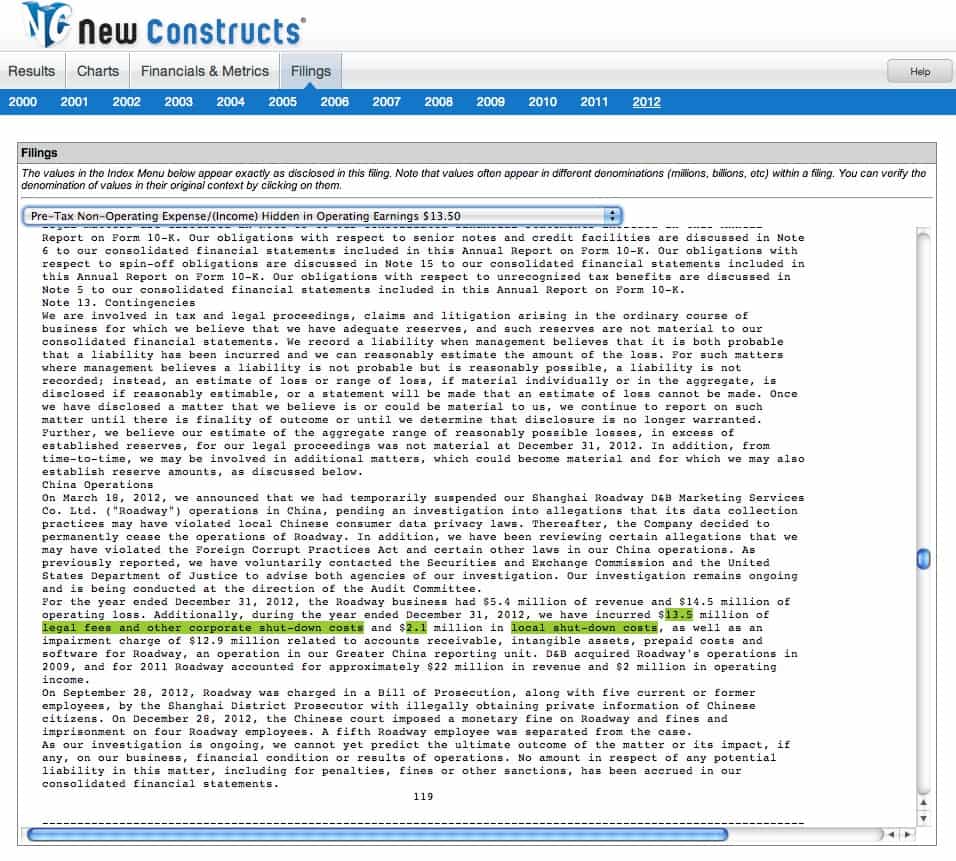
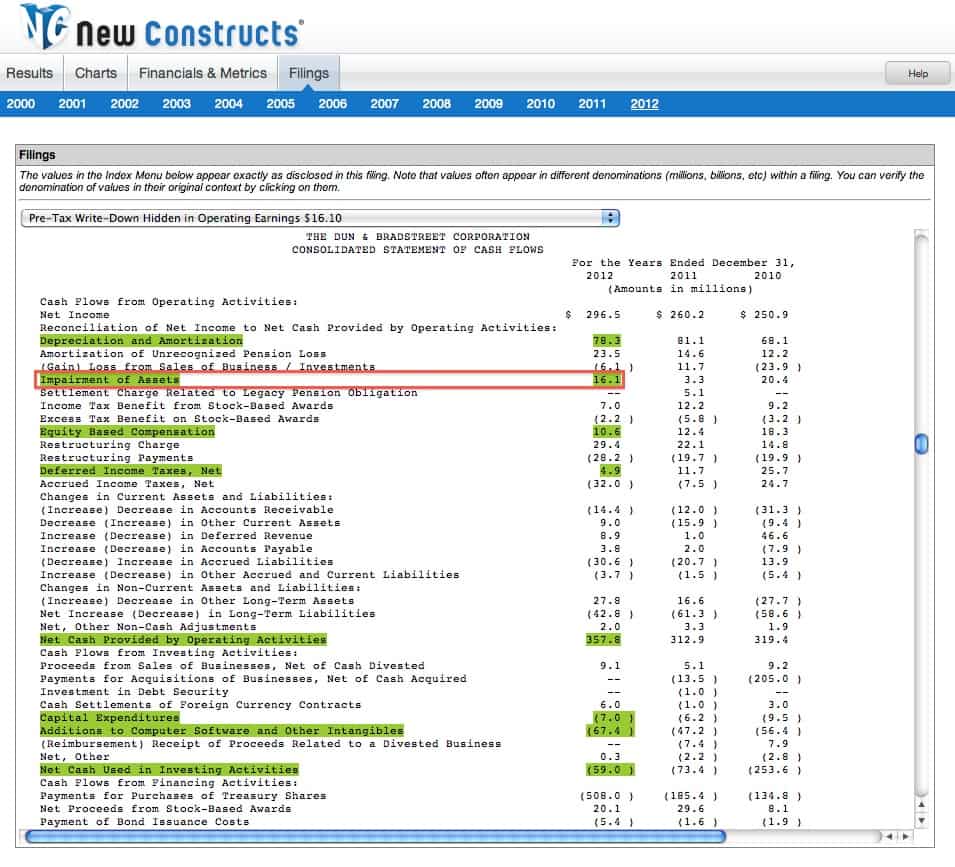
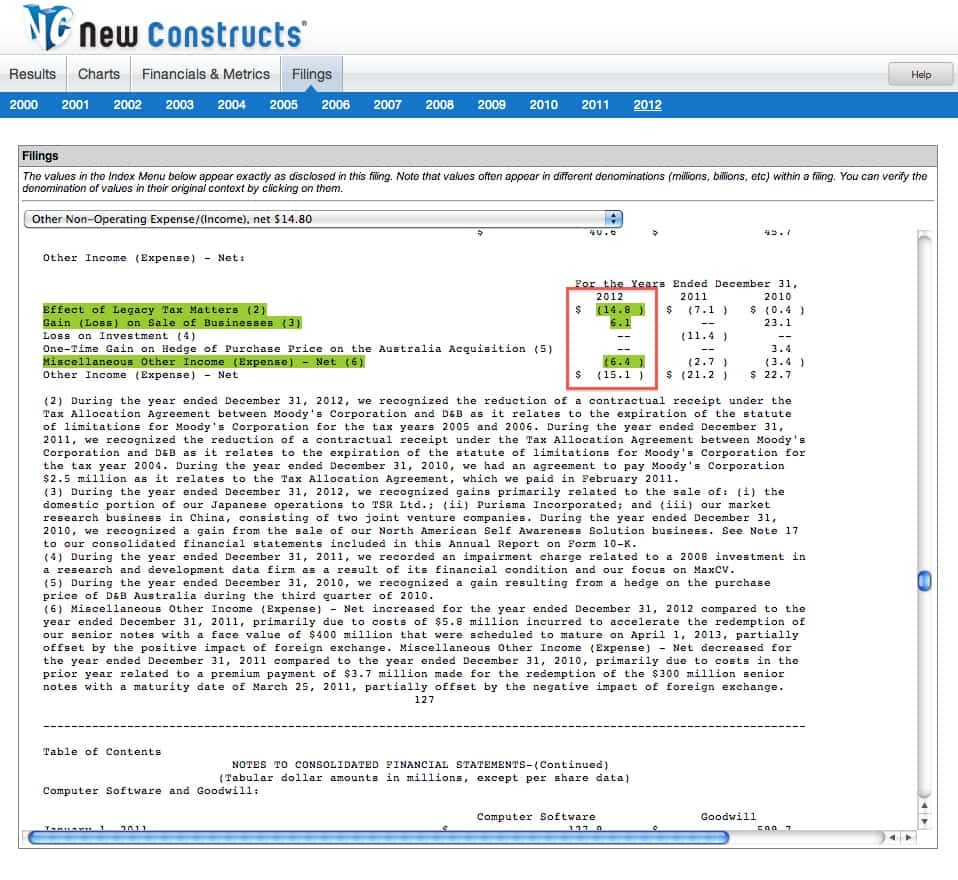
The Dun & Bradstreet Corp (DNB) is one of my favorite stocks held by Industrials ETFs and mutual funds. DNB earns my Very Attractive rating and also makes this month’s Most Attractive stocks list. The corporate data provider has grown after-tax profit (NOPAT) by 8% compounded annually over the past decade. DNB’s 2012 GAAP net income significantly understates the company’s true after-tax cash flow (NOPAT). Our NOPAT metric removes unusual non-operating expenses such as: 1) $15 million to shut down its China “Roadway” business 2) $30 million in restructuring charges 3) $16 million in write-downs, and 4) $15 million in various non-operating losses buried in “other income”. All told, DNB’s 2012 NOPAT of $370 million was 25% greater than its reported earnings.
DNB is also significantly undervalued, perhaps due to its deceptively low reported earnings. At its current valuation of ~$102/share, DNB has a price to economic book value ratio of 1, which means the market expects absolutely no future growth from the company. DNB has a solid track record of growth, and the demand for data increases every day. Investors should be able to bank on profit growth and capital gains from this stock.
Precision Castparts Corp (PCP) is one of my least favorite stocks held by Industrials ETFs and mutual funds and earns my Dangerous rating. PCP’s return on invested capital (ROIC) has declined from 21% in 2008 down to 12% in 2012. PCP has also had negative free cash flow for the past two years. Despite these troubling signs, the stock is richly valued at ~$233/share. That valuation implies that the company will grow NOPAT by 11% compounded annually for the next 14 years. I wouldn’t want to bet on that much growth from a company that has declining returns on capital and negative cash flows. In addition, PCP is vulnerable to potential government cuts in aerospace defense spending. I see a great deal of risk and little potential upside to this stock.
414 stocks of the 3000+ I cover are classified as Industrials stocks, but due to style drift, Industrials ETFs and mutual funds hold 471 stocks.
Figures 4 and 5 show the rating landscape of all Industrials ETFs and mutual funds.
My Sector Rankings for ETFs and Mutual Funds report ranks all sectors and highlights those that offer the best investments.
Figure 4: Separating the Best ETFs From the Worst ETFs
 Sources: New Constructs, LLC and company filings
Figure 5: Separating the Best Mutual Funds From the Worst Mutual Funds
 Sources: New Constructs, LLC and company filings
Review my full list of ratings and rankings along with reports on all 16 ETFs and 18 mutual funds in the Industrials sector.
Sam McBride contributed to this report.
Disclosure: David Trainer owns DNB. David Trainer and Sam McBride receive no compensation to write about any specific stock, sector or theme.