The Mid Cap Value style ranks ninth out of the twelve fund styles as detailed in our 3Q16 Style Ratings for ETFs and Mutual Funds report. Last quarter, the Mid Cap Value style ranked seventh. It gets our Dangerous rating, which is based on an aggregation of ratings of nine ETFs and 129 mutual funds in the Mid Cap Value style as of August 4, 2016. See a recap of our 2Q16 Style Ratings here.
Figure 1 ranks from best to worst the eight Mid Cap value ETFs that meet our liquidity standards and Figure 2 shows the five best and worst rated Mid Cap value mutual funds. Not all Mid Cap Value style ETFs and mutual funds are created the same. The number of holdings varies widely (from 39 to 1752). This variation creates drastically different investment implications and, therefore, ratings.
Investors seeking exposure to the Mid Cap Value style should buy one of the Attractive-or-better rated ETFs or mutual funds from Figures 1 and 2.
Figure 1: ETFs with the Best & Worst Ratings – Top 5

* Best ETFs exclude ETFs with TNAs less than $100 million for inadequate liquidity.
Sources: New Constructs, LLC and company filings
ValueShares U.S. Quantitative Value ETF (QVAL) is excluded from Figure 1 because its total net assets (TNA) are below $100 million and do not meet our liquidity minimums.
Figure 2: Mutual Funds with the Best & Worst Ratings – Top 5

* Best mutual funds exclude funds with TNAs less than $100 million for inadequate liquidity.
Sources: New Constructs, LLC and company filings
Vident Core U.S. Equity Fund (VUSE) is the top-rated Mid Cap Value ETF and Reinhart Mid Cap Private Market Value Fund (RPMVX) is the top-rated Mid Cap Value mutual fund. Both earn an Attractive rating.
PowerShares Russell MidCap Pure Value Portfolio (PXMV) is the worst rated Mid Cap Value ETF and Quaker Mid Cap Value Fund (QMCVX) is the worst rated Mid Cap Value mutual fund. PXMV earns a Dangerous rating and QMCVX earns a Very Dangerous rating.
Goodyear Tire & Company (GT: $27/share) is one of our favorite stocks held by Mid Cap Value ETFs and mutual funds and earns an Attractive rating. Goodyear Tire was a featured Long Idea in February 2015. Over the past decade, Goodyear Tire has grown after-tax profit (NOPAT) by 8% compounded annually. The company has improved its return on invested capital (ROIC) from 5% in 2005 to 9% over the last twelve months and generated $4.9 billion in free cash flow over the last five years. Despite the improving fundamentals, GT remains undervalued. At its current price of $27/share, Goodyear Tire has a price-to-economic book value (PEBV) ratio of 0.6. This ratio means the market expects GT’s NOPAT to permanently decline by 40%. If GT can grow NOPAT by just 1% compounded annually for the next decade, the stock is worth $44/share today – a 63% upside.
Beacon Roofing Supply (BECN: $46/share) is one of our least favorite stocks held by Mid Cap Value ETFs and mutual funds and earns a Very Dangerous rating. Beacon’s economic earnings have declined from $4 million in 2005 to -$54 million over the last twelve months. Over the same time, the company’s ROIC has more than halved, from 12% in 2005 to 5% TTM. Despite the deterioration of fundamentals, BECN is up over 100% over the past decade, which leaves shares overvalued. To justify its current stock price of $46/share, BECN must grow NOPAT by 23% compounded annually for the next 15 years. This expectation seems overly optimistic given the past decade of shareholder value destruction.
Figures 3 and 4 show the rating landscape of all Mid Cap Value ETFs and mutual funds.
Figure 3: Separating the Best ETFs From the Worst Funds
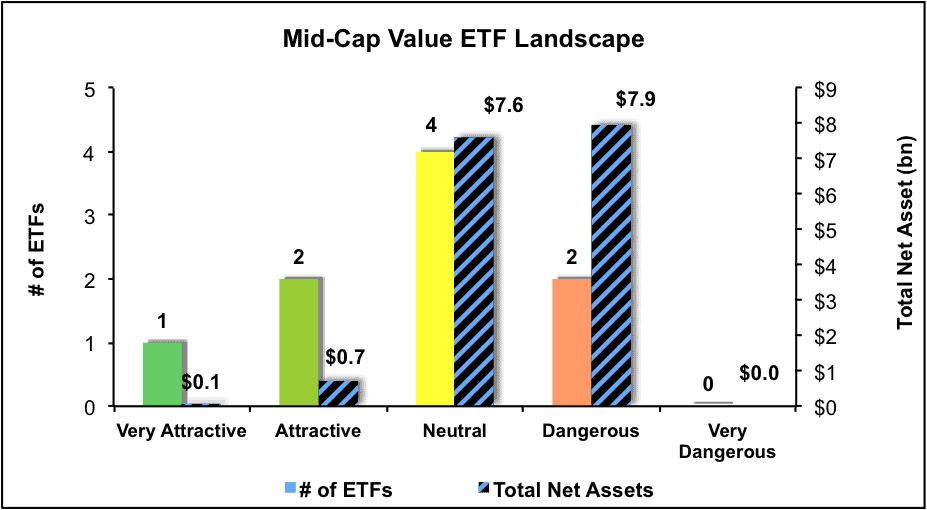
Sources: New Constructs, LLC and company filings
Figure 4: Separating the Best Mutual Funds From the Worst Funds
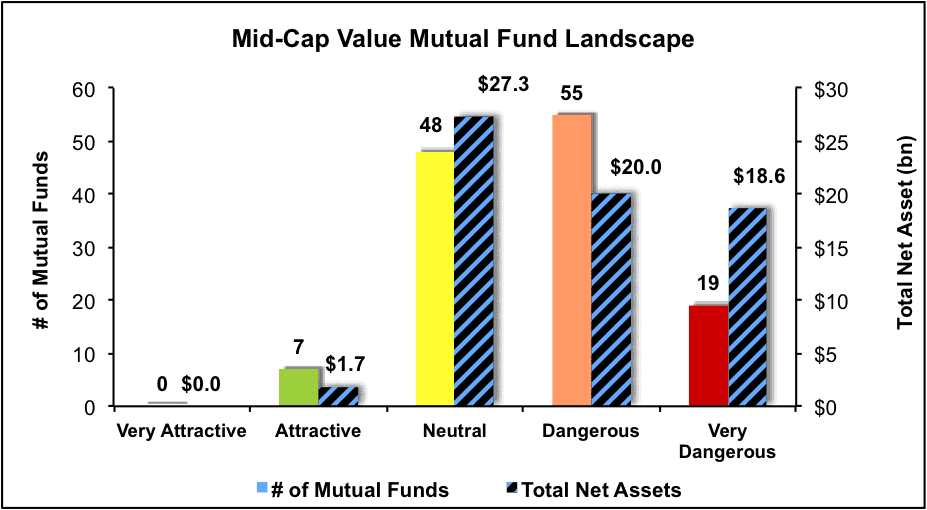
Sources: New Constructs, LLC and company filings
This article originally published here on August 5, 2016.
Disclosure: David Trainer and Kyle Guske II receive no compensation to write about any specific stock, style, or theme.
Click here to download a PDF of this report.