Best & Worst ETFs & Mutual Funds October 2012: Consumer Staples Sector
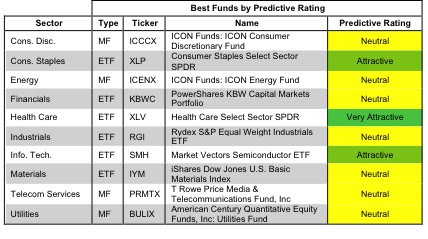
The Consumer Staples sector ranks first out of the ten sectors as detailed in my sector rankings for ETFs and mutual funds. It gets my Attractive rating, which is based on an aggregation of the ratings of 9 ETFs and 9 mutual funds in the Consumer Staples sector as of October 9, 2012. Reports on the best & worst ETFs and mutual funds in every sector and style are here.