Check out this week’s Danger Zone Interview with Chuck Jaffe of Money Life and MarketWatch.com.
EPIQ Systems (EPIQ) is in the Danger Zone this week. The legal technology solutions provider has misleadingly high reported earnings due to a funny accounting rule. Analysts and investors looking at reported earnings have assigned unreasonably high expectations to EPIQ. Both the implied expectations in its valuation and the explicit earnings estimates require an unrealistically high amount of profit growth. While GAAP data shows growing profits, deeper analysis of the footnotes reveals a company with shrinking margins and flat profits.
Red Flags and Misleading Income Uncovered By Footnotes Diligence
Contingent considerations are conditional payments as part of an acquisition that only occur if a certain target is met. For instance, a large pharmaceutical company acquiring a small biotech might have a significant contingent consideration that would only be paid out if certain new drugs received FDA approval.
The company is required to record the value of the contingent consideration (Cost of consideration X Probability the target is met) as a liability. The buyer then must remeasure the fair value of the contingent consideration in each reporting period. Significant changes in the probability of the target being met can lead to large swings in the fair value of the contingent consideration, which is then recorded as either income or expense. In the last fiscal year, 57 different companies recorded income from fair value adjustments to contingent consideration.
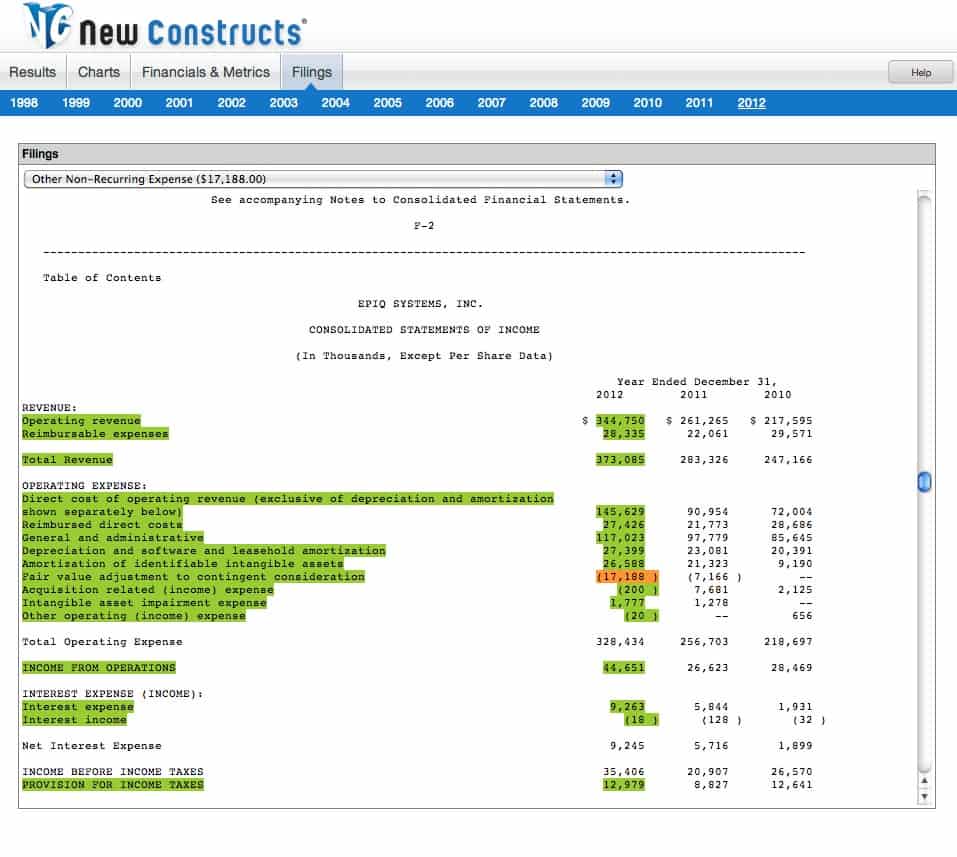
In 2012, EPIQ recorded $17.2 million in income from fair value adjustments to contingent considerations. De Novo Legal, which EPIQ acquired in 2011, did not meet the revenue target required to trigger a contingent consideration payment. A large contingent consideration adjustment like this one artificially inflates earnings and signals to investors that an acquisition was not as successful as the company anticipated.
Fortunately for investors, that $17.2 million is disclosed directly on the income statement for investors to find and remove (though some analysts, like the author of this Motley Fool article, still rely directly on unadjusted GAAP income). There is more income from contingent consideration hidden in the footnotes, though.
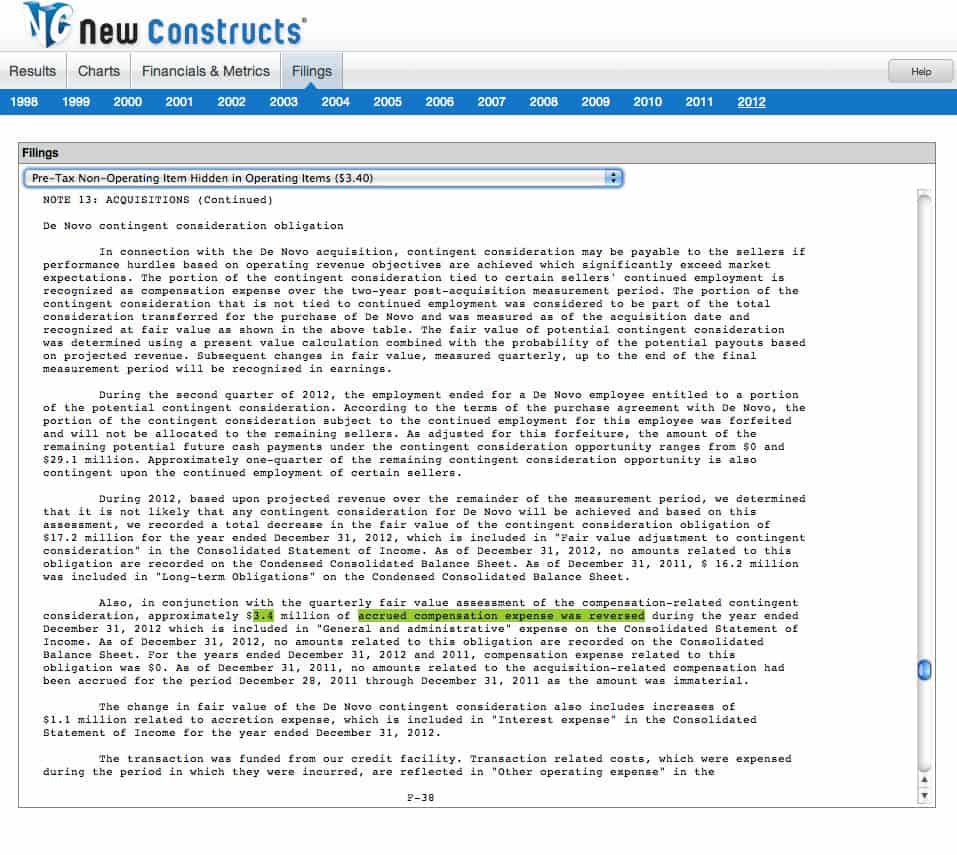
Buried on the 87th page (and the 39th page of footnotes) of EPIQ’s 2012 Form 10-K is the disclosure that “$3.4 million of accrued compensation expense was reversed” in 2012 based on revaluation of another compensation-related contingent consideration. Hidden within “General and administrative” expense on the income statement, this items is found only in the footnotes. Without proper diligence in the footnotes, investors would never know that 15% of EPIQ’s 2012 GAAP net income in 2012 came from a non-recurring item.
Declining Margins
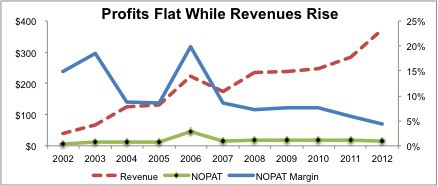
Figure 1 shows EPIQ’s margins declining since 2006. After-tax profit (NOPAT) is flat while revenues rise.
Figure 1: Profits Are Stagnant As Margins Compress
 Sources: New Constructs, LLC and company filings
The spike on that graph in 2006 represents the peak of bankruptcy filings, a key part of EPIQ’s business. Since then, bankruptcies have been in decline, decreasing by 23% over the past two years alone.
EPIQ’s bankruptcy segment is its highest margin segment, accounting for 26% of revenue and 33% of net income in 2012. Over the past two years, revenue from EPIQ’s bankruptcy segment has declined by 9%.
The bullish case for EPIQ is based largely around its eDiscovery segment. The electronic discovery industry is growing rapidly, and EPIQ’s revenue growth in recent years has been driven almost entirely by eDiscovery. Unfortunately, the eDiscovery market is also highly competitive with low differentiation, hence the declining margins in Figure 1. It is not the profit savior investors need to justify the profit growth expectations in the stock.
Unreasonable expectations
Too often, analysts and investors base their expectations off reported earnings without adjusting out non-recurring items and looking at return on invested capital (ROIC). EPIQ had reported earnings of $22 million last year, while its true operating profit (NOPAT) was 27% less at $16 million. Its ROIC, the truest measure of efficiency and profitability, was a bottom-quintile 3%. Its economic earnings, the true, apples-to-apples measure of profits after footnotes adjustments, were only -$26.7 million.
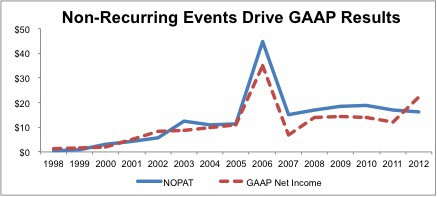
Consensus estimates have EPIQ growing net income by 10% in 2013. Since so much of its income came from non-recurring items, EPIQ would actually need to grow NOPAT by nearly 50% to reach these lofty targets. Don’t expect net income to be significantly higher than NOPAT again next year either. Since 2000, GAAP net income has never been greater than NOPAT for more than a single year at a time.
Figure 2: Net Income Rarely Exceeds NOPAT
 Sources: New Constructs, LLC and company filings
Look for downward revisions in earnings estimates before the end of the year. EPIQ might be able to manage quarterly earnings, which are unaudited and don’t contain footnotes. It won’t be able to maintain its inflated appearance of profitability in its annual report, though.
Long-term, the prospects for EPIQ look bleak. To justify its valuation of ~$14/share, the company must grow NOPAT 20% compounded annually for 15 years. Even assuming EPIQ can maintain margins and market share as the eDiscovery industry grows, it’s hard to construct a scenario where it can meet those lofty expectations.
Investors looking at EPIQ as a growth stock need to do proper diligence to see that there is not as much growth as GAAP results suggest. In reality, EPIQ has shrinking margins, stagnant profits, and 1/3 of the company is in a long-term decline. To even meet analyst estimates for the year it needs nearly 50% growth in profits. Look for analysts, and the market, to sour on EPIQ in the near future as its artificially high profits are stripped away and its true profitability revealed.
Fortunately for ETF and mutual investors, fund providers appear to be steering clear of this stock. No ETF or mutual fund that I cover allocates more than 2.2% of assets to EPIQ.
Sam McBride contributed to this article.
Disclosure: David Trainer and Sam McBride receive no compensation to write about any specific stock, sector, or theme.