
We recently published our quarterly Best and Worst ETFs and Mutual Funds reports that rank all 11 sectors from Very Attractive to Very Unattractive. These reports provide a bottom-up assessment of the fundamental risk/reward in each sector based upon the stocks in those sectors.
This quarter, one sector in particular stood out, and not for good reasons.
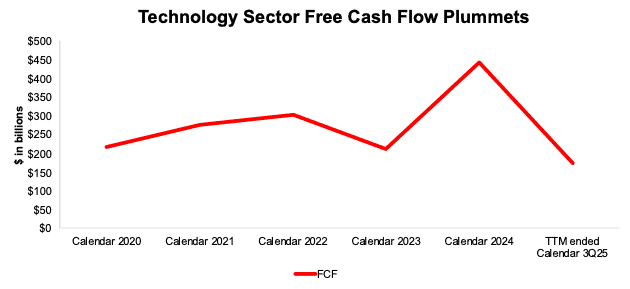
We’ve all seen the headlines about the rising grip the Tech sector, especially a few tech giants, have on the market. Despite the high-growth and AI narratives that drive rising stock prices, a hidden danger grows: while reported earnings rise, cash flow is in major decline. See Figure 1.
As a result, the outsized profits that Wall Street gushes over are not real. Because of this mirage, the Technology sector now earns our Unattractive rating, a downgrade from its Neutral rating, which it maintained from 4Q21 to 4Q25.
This recent downgrade, along with the falling cash flows and rising debt make the Technology sector look increasingly overvalued and land it in the Danger Zone.
Cash Flow Takes a Nosedive
While earnings continue to rise, tech companies’ balance sheets, in particular total debt, are growing ever faster. As a result, the sector’s free cash flow (FCF) took a nosedive.
This trend is the ugly part of the AI race. As we detailed in a prior Danger Zone report: The Losers in the AI Arms Race, the spending required to stay in the AI race is gargantuan. We see that cash drain manifest in the steep decline in the overall sector’s free cash flow.
In the trailing twelve months ended calendar 3Q25, the Technology sector’s FCF fell to $174 billion from $444 billion in calendar 2024. See Figure 1.
The drop in TTM ended calendar 3Q25 FCF comes as total debt in the Technology sector ballooned from $1.9 trillion in calendar 2024 to $2.2 trillion over the TTM ended calendar 3Q25.
Figure 1: Technology Sector Free Cash Flow: Last Five Years and TTM
Sources: New Constructs, LLC and company filings
Free cash flow data incorporates the financial data available as of January 20, 2026, which is the calendar 3Q25 10-Q for all companies with standard calendar years.
The Biggest Cash Burners
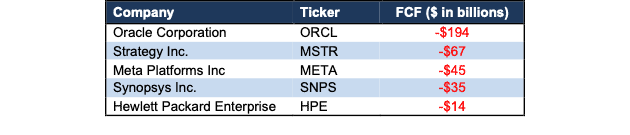
As the AI race forces companies to spend unprecedented amounts of capital to develop and scale AI capabilities, we’re seeing a clear line between the companies that can afford to stay in the race and those that cannot. We think with companies with negative free cash flow are at a significant disadvantage to those that can keep spending and keep FCF positive. See Figure 2.
Figure 2: Technology Sector’s Largest Cash Burners
Sources: New Constructs, LLC and company filings
Perhaps unsurprisingly, Meta and Oracle (ORCL) are two of the five largest contributors to the sector’s FCF decline. Over the TTM, Meta and Oracle burned -$67 billion and -$194 billion in FCF, respectively.
Hiding Losses in Off-Balance Sheet Debt
Not only is Oracle’s free cash flow the worst, it is also hard to find because it’s hidden by off-balance sheet debt.
Specifically, in its fiscal 2Q26 10-Q, Oracle disclosed $248 billion in not yet commenced leases. These leases, “substantially all related to data centers and cloud capacity arrangement” are not included on Oracle’s balance sheet…yet. But, they do represent real capital allocated.
Not yet commenced leases are a new way to hide debt off the balance sheet post recent accounting rule changes (ASC 842 and IFRS 16). We find and include these lease obligations in our invested capital calculation to ensure we capture everything companies need to generate revenue and deliver clients accurate research.
When we include off-balance sheet debt in our calculation of total debt, we find that the Technology sector’s total debt increased from $1.3 trillion in calendar 2020 to $2.2 trillion over the TTM ended calendar 3Q25.
Regardless of any accounting tricks used, we think the companies in Figure 2 will struggle to finish the AI race.
Earnings Are Not Enough: The Profit Mirage
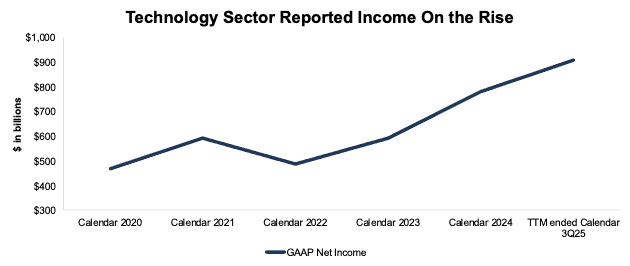
Most earnings analysis stops at the income statement because Wall Street doesn’t want investors to pay attention to balance sheets or capital spending. Plus, earnings paint a pretty picture in recent years. See Figure 3.
Figure 3: Technology Sector GAAP Net Income: Last Five Years and TTM
Sources: New Constructs, LLC and company filings
GAAP net income data incorporates the financial data available as of January 20, 2026, which is the calendar 3Q25 10-Q for all companies with standard calendar years.
Despite the pretty picture for sector earnings, there is an ugly truth buried in those numbers.
The five most profitable companies, Alphabet (GOOGL), Apple (AAPL), Microsoft (MSFT), NVIDIA (NVDA), and Meta (META), generated a combined $499 billion in GAAP net income over the TTM ended calendar 3Q25, or 55% of the entire sector’s GAAP net income. These five stocks are <1% of the stocks in the entire Technology sector.
No wonder they have such an outsized influence on the overall market.
Technology Sector Downgraded to Unattractive Risk/Reward
The combination of falling FCF, rising debt, and increasingly expensive valuations leaves the overall Technology sector in a precarious position. Yes, as a whole, the sector generates billions in net income, but all that profit and a huge amount of future profits are already priced into the sector’s valuation.
For example, of the 595 Technology sector stocks we cover:
- only 28% have an Attractive-or-better FCF Yield (> 3%),
- only 17% have an Attractive-or-better market-implied growth appreciation period (GAP), <10 years, and
- only 14% have an Attractive-or-better price-to-economic book value (PEBV) ratio, positive and <1.6.
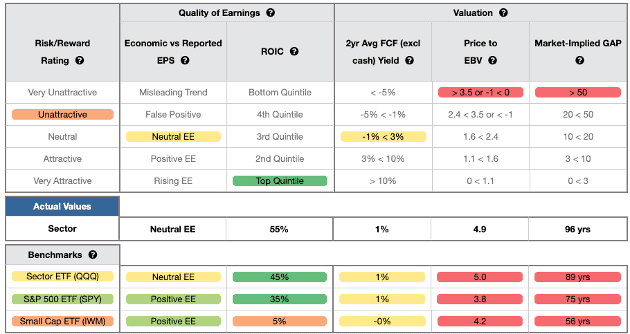
Figure 4 shows our detailed rating for the Technology sector, which includes each of the criteria we use to rate the overall sector. These criteria are the same for our Stock Rating Methodology, because our sector ratings are based on a normalized aggregation of our ratings for each stock in a given sector. Figure 4 also compares the Technology sector’s rating with those of QQQ, SPY, and IWM.
Figure 4: Technology Sector Breakdown
Sources: New Constructs, LLC and company filings
The Technology sector stocks look much more expensive than the S&P 500, which is already expensive. Specifically:
- The Technology sector’s 2-yr avg FCF yield of 1% is equal to SPY.
- The PEBV ratio for the Technology sector is 4.9, which is higher (worse) than SPY’s at 3.8.
- Our discounted cash flow analysis reveals an average market-implied GAP of 96 years for the Technology sector stocks compared to 75 years for SPY.
The Technology sector is more profitable than the S&P 500 (as measured by ROIC), but the stocks in the sector are much more expensive, as measured by the higher PEBV and market-implied GAP.
With a PEBV ratio of 4.9 and a market-implied GAP of 96 years, it’s clear the Technology sector is highly overvalued.
For context, a PEBV ratio of 4.9 means the market expects the sector’s profits to grow 4.9x from current levels.
Lots of Expensive Stocks in the Tech Sector
The sector’s expensive valuations and the outsized profitability of its largest players are reflected in our ratings of the stocks within the sector as well.
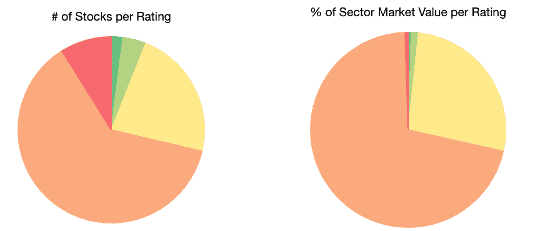
Per Figure 5, 94% of the 595 stocks in the Technology sector earn a Neutral-or-worse rating. These stocks make up 98% of the market cap in the entire Technology Sector.
Even worse, 71% of the stocks in the Technology sector earn an Unattractive-or-worse rating and make up 71% of the market cap of the sector.
Just 6% of stocks in the entire sector earn an Attractive-or-better rating and those stocks make up just 2% of the sector market cap.
Figure 5: Technology Sector Stock Rating Distribution
Sources: New Constructs, LLC and company filings
The Worst Funds in The Technology Sector
Below we present the worst Technology funds in our coverage universe. The combination of poor holdings and expensive costs make these funds particularly risky in a sector that already provides Unattractive risk/reward.
Each of these funds earns a Very Unattractive rating.
- MSIF Growth Portfolio (MGRHX) – 8.01% TAC
- MSIF Advantage Portfolio (MAPPX) – 4.02% TAC
- MSIF Growth Portfolio (MSEGX) – 3.54% TAC
- Saratoga Advantage Technology & Communications Portfolio – 5.21% TAC
- MSIF Growth Portfolio (MSGUX) – 2.37% TAC
For more details on the Best & Worst ETFs & Mutual Funds in the Technology sector, see our Technology Sector 1Q26: Best and Worst report.
This article was originally published on January 27, 2026.
Disclosure: David Trainer and Kyle Guske II receive no compensation to write about any specific stock, style, or theme.
Questions on this report or others? Join our online community and connect with us directly.