
Check out this week’s Danger Zone interview with Chuck Jaffe of Money Life.
Unusual gains/losses distorted earnings per share by an average of $1.16/share (22%) for firms in the S&P 500 in 2018. The popular measures of “core” earnings – i.e. street earnings[1], Compustat[2] or non-GAAP metrics – do not properly account for unusual items and are subject to significant bias according to new research from Harvard Business School (HBS) and MIT Sloan.
Why is earnings data wrong?
In “Core Earnings: New Data and Evidence,” Ethan Rouen and Charles Wang from HBS and Eric So from MIT Sloan show that traditional data providers and analysts are missing or mis-categorizing a very material and growing amount of unusual gains/losses.
“…many of the …{unusual gains/losses} collected by New Constructs do not appear to be easily identifiable in Compustat…” – page 13
The authors show the market is inefficiently assessing earnings because too few people read financial footnotes.
Earnings Data Is Getting Worse
The average per share impact of unusual items has increased 170% from $0.43/share in 1998 to $1.16 at the end of 2018. Figure 1 plots the total impact of unusual items or “Total Adjustments”.
Figure 1: Total Adjustments Per Share for the S&P 500
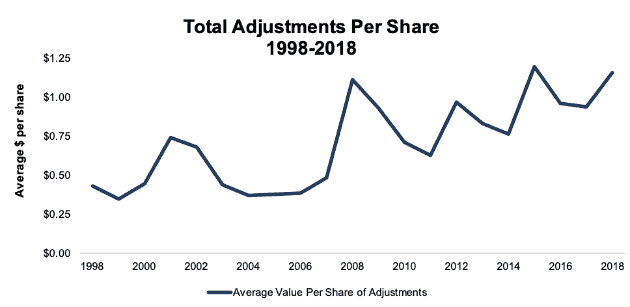
Sources: New Constructs, LLC and company filings
Excludes Berkshire Hathaway (BRK.A), which represents a significant outlier in all years
Total Adjustments captures the after-tax value of all the unusual items that we collect from the income statement and the footnotes. Though our numbers bear a close resemblance, the HBS & MIT paper is circumspect about exactly which of our adjustment are used to provide the superior measure of “core earnings” featured in the paper. To bring as much value as possible to investors, we share details on all of our adjustments.
For a full description of the adjustments used here and in the HBS paper, please see the final section of this report and the Appendix.
How You Can Protect Your Portfolio
“Trading strategies that exploit {adjustments provided by New Constructs} produce abnormal returns of 7-to-10% per year.” – Abstract, 4th sentence
The paper presents a long/short strategy that holds the stocks with the most understated EPS and shorts the stocks with the most overstated earnings. Positions are opened in the month each 10-K is filed and held until the next 10-K is filed, or about a year.
This simple, low turnover strategy produced abnormal returns of 7-to-10% a year. These abnormal returns show that the market misses important data in the footnotes and that investors who adjust for unusual items can better protect their portfolios.
Here’s a Short/Sell Idea Based on our Proprietary Data
Our research shows that Linde, PLC (LIN: $194/share) is a stock investors should avoid ahead of its Q3 earnings report on November 12. LIN had some of the largest income adjustments, or most overstated earnings, of all companies in the S&P 500 in 2018. LIN had nearly $2.2 billion in net non-recurring income reported on the income statement and hidden in the footnotes. Our largest adjustment was removing the company’s $2.9 billion after-tax gain on sale of assets divested as part of its merger with Praxair, disclosed on the cash flow statement.
We identified $6.48/share in non-recurring income that artificially increased reported earnings. This income was offset by $0.82/share in non-recurring expenses. In total, we identified $5.67/share in net non-recurring income.
Without our adjustments, LIN’s reported EPS more than tripled, from $4.31/share in 2017 to $13.11/share in 2018. However, after removing non-recurring items, we find that LIN’s core earnings grew much more modestly, from $5.14/share in 2017 to $7.44/share in 2018. Furthermore, core earnings were well above reported EPS in 2017, and were nearly half reported EPS in 2018.
Although the HBS paper did not focus on our quarterly data, our models do incorporate data from 10-Q’s in order to create trailing twelve months (TTM) models for companies. On a TTM basis, LIN’s core earnings of $5.26/share are significantly below reported earnings of $9.96/share.
LIN’s overstated earnings make it more likely to miss expectations when it reports 3rd quarter earnings.
Investors who rely on reported earnings might think that LIN’s P/E ratio of 20 (below the S&P 500 at 22) is cheap. Using core earnings per share, on the other hand, LIN has a P/E ratio of 36, which is a much better reflection of the high growth expectations implied by the stock price.
The combination of overstated earnings and an expensive valuation earns LIN our Very Unattractive rating. The stock is also in our Most Dangerous Stocks Model Portfolio.
More Stocks to Sell: Most Hidden Gains and Overstated Earnings
Figure 2 shows the firms in the S&P 500 with the largest after-tax income adjustments in 2018. These items artificially increase reported earnings and must be removed to calculate a firm’s true recurring profitability.
Figure 2: Top 5 Net Hidden Income After Tax in 2018 – $ value
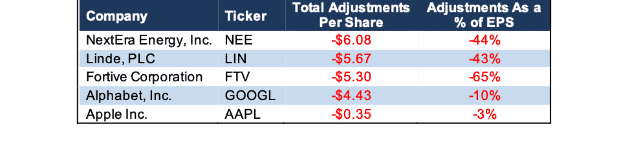
Sources: New Constructs, LLC and company filings
While our data and models are updated daily as new 10-K and 10-Qs are filed, we’re only showing data through 2018 because we do not give away too much valuable data for free.
Exploit Market Inefficiencies Instead of Getting Exploited
“… adjustments made by analysts to better capture core earnings are incomplete...the non-core items identified by New Constructs produce a measure of core earnings that is incremental to alternative measures of operating performance in predicting an array of future income measures.” – page 26
– “Core Earnings: New Data and Evidence”
The above quote summarizes the key takeaway from the HBS paper. Reported and “core” earnings from traditional providers don’t provide a clear picture of companies’ recurring earnings. As a result:
- markets are inefficiently assessing earnings because no one reads the footnotes.
- technology is now bringing all this very material footnotes data to market for the first time ever.
Material information is buried in the footnotes – critical information needed to assess core earnings.
Defining Total Adjustments in This Analysis
In this report, Total Adjustments includes
- + Acquisition and Merger Expenses, net
- + Foreign Currency Expenses, net
- + Legal Regulatory and Insurance Expenses, net
- + Company Defined Other Expenses, net
- + Other Non-Recurring Expenses, net
- + Other Real Estate Owned Expenses, net
- + Other Financing Expenses, net
- + Derivative Related Expenses, net
- + Pension Related Expenses, net
- + All Restructuring Expense, net
- + Minority Interest Expense, net
- + Preferred Dividends, net
See Figure I in the Appendix for the definition of core earnings and total adjustments used in the HBS & MIT Sloan paper.
We further breakdown each of the adjustment categories above in Figure II of the Appendix. This level of granularity allows investors to get a clear picture of all adjustments required to calculate a firm’s true earnings.
Appendix 2 provides details on the most complete data set we offer clients here.
This article originally published on October 25, 2019.
Disclosure: David Trainer, Kyle Guske II, and Sam McBride receive no compensation to write about any specific stock, sector, style, or theme.
Follow us on Twitter, Facebook, LinkedIn, and StockTwits for real-time alerts on all our research.
Appendix 1
Figure I contains the definition of core earnings used in the HBS & MIT Sloan paper. Certain adjustment categories we included in the analysis above were aggregated into the definition below. We believe breaking out these adjustments is necessary to ensure all necessary adjustments are captured and accounted for in calculating core earnings.
Figure I: Core Earnings Defined in the HBS & MIT Sloan Paper
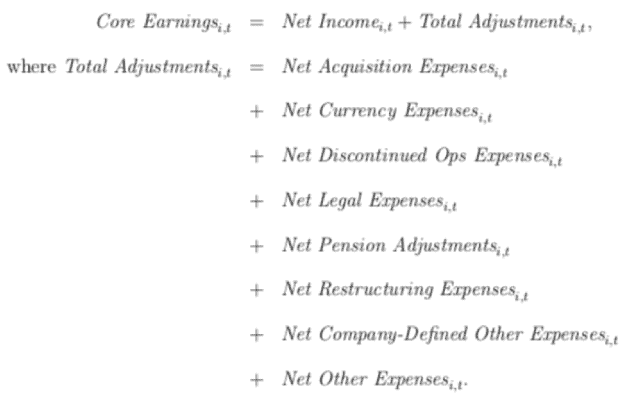
Sources: Core Earnings: New Data and Evidence
Figure II details each specific adjustment type included in the total adjustments we detailed in this report.
Figure II: Breakdown of Adjustment Categories
The hidden and reported adjustment categories included in Total Adjustments defined earlier can be further broken down into the following adjustments:
- Acquisition and Merger Expenses, net
- Foreign Currency Expenses, net
- All Restructuring Expenses, net
- Write-downs
- Discontinued Operations
- Other Restructuring
- Legal, Regulatory, and Insurance Expenses, net
- Pension Related Expenses, net
- Recurring
- Non-Recurring
- Company Defined Other Expenses, net
- Other Non-Recurring Expenses, net
- Other Real Estate Owned Expenses, net
- Other Financing Expenses, net
- Derivative Related Expenses, net
- Minority Interest Expenses, net
- Redeemable Preferred Dividends, net
Sources: New Constructs, LLC
Most of these categories have a 1-1 correlation with the categories in the HBS paper:
- Acquisition and Merger Expenses, net = Net Acquisition Expenses
- Foreign Currency Expenses, net = Net Currency Expenses
- Legal, Regulatory, and Insurance Expenses, net = Net Legal Expenses
- Pension Related Expenses, net = Net Pension Adjustments
- Company Defined Other Expenses, net = Net Company-Defined Other Expenses
Other categories combine multiple categorizations in the HBS paper:
- All Restructuring Expenses, net = Net Restructuring Expenses + Net Discontinued Ops Expenses
However, we are not sure which of our adjustments are included in “Net Other Expenses” in the paper. We are also unsure if or how the authors accounted for the tax impact of non-recurring items.
Appendix 2
The HBS paper focuses on core earnings for direct comparison with GAAP earnings, IBES and First Call earnings, and Compustat’s “income before extraordinary items” and “income minus special items”. Our preferred measure of profitability, net operating profit after tax (NOPAT), includes all the items in the HBS & MIT Sloan paper as well as several others. Our complete reconciliation of GAAP net income to NOPAT is below. To purchase this data for nearly all U.S. stocks from 1998 – 2018 click here.
Reported GAAP Net Income
Total Net Non-Operating Expenses Hidden in Operating Earnings
- + Hidden Total Restructuring Expenses, net
- + Hidden Foreign Currency Expenses, net
- + Hidden Other Real Estate Owned Expenses, net
- + Hidden Acquisition and Merger Expenses, net
- + Hidden Legal, Regulatory and Insurance Expenses, net
- + Hidden Derivative Related Expenses, net
- + Hidden Other Financing Expenses, net
- + Hidden Other Non-Recurring Expenses, net
- + Hidden Recurring, Non-Operating Pension Expenses, net
- + Hidden Non-Recurring Pension Expenses, net
- + Hidden Company Defined Other Expenses, net
Reported Net Non-Operating Expenses
- + Reported Derivative Related Expenses, net
- + Reported Other Financing Expenses, net
- + Reported Company Defined Other Non-Operating Expenses, net
- + Reported Acquisition and Merger Expenses, net
- + Reported Legal, Regulatory, and Insurance Related Expenses, net
- + Reported Interest Expense/(Income), net
- + Reported Expenses/(Income) from Discontinued Operations, net
- + Reported Losses/(Income) from Unconsolidated Subsidiaries, net
- + Reported Foreign Currency Loss/(Gain), net
- + Reported Non-Operating Other Real Estate Owned Expense/(Income), net
- + Reported Other Non-Operating Expense/(Income), net
- + Reported Write-Downs, net
- + Reported Restructuring Expense, net
- + Reported Other Non-Recurring Expense/(Income), net
Derived Datapoints
- + Change in Total Reserves
- + Goodwill Amortization Expenses, net
- - ESO Expense (Employee Stock Options), net
- + Interest for PV of Operating Leases
- + Quarterly/Annual Classification Disclosure Adjustments, net
- + Non-Operating Tax Adjustment
Net After-Tax Non-Operating Expense/(Income)
- +Reported Minority Interest Expenses, net
- + Reported Loss/(Gain) from Discontinued Operations, net
- + Reported Preferred Stock Dividends, net
- + Reported Redeemable Preferred Stock Dividends, net
- + Reported Other After-tax Charges, net
= NOPAT (Net Operating Profit After Tax)
[1] From First Call and IBES
[2] Both “income before extraordinary items” and “income minus special items”