For the week of 1/20/20-1/24/20, we focus on the Earnings Distortion scores for 55 companies.
We measure earnings distortion using a proprietary human-assisted machine learning methodology featured in a recent paper from Harvard Business School (HBS) and MIT Sloan. This paper shows that street earnings estimates are incomplete and less accurate since they do not adjust for unusual gains/losses buried in footnotes.
As corporate managers bury key data in footnotes to manipulate earnings, and investors miss them, investment opportunities arise because stock prices tend to be driven by core earnings power.
Our Earnings Distortion Scores[1] empower investors to combat management efforts to obfuscate financial performance. The aggregate level of distortion recently reached heights not seen since right before the tech bubble and the financial crisis.
Weekly Earnings Distortion Insights
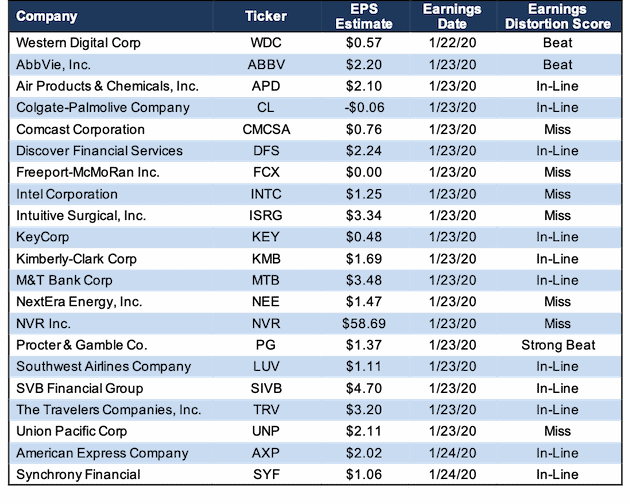
Figure 1 contains the 15 largest S&P 500 companies, plus those with market caps greater than $10 billion, that we expect to beat or miss earnings expectations the week of January 20, 2020.
Figure 1: Earnings Distortion Scorecard Highlights: Week of 1/20/20-1/24/20
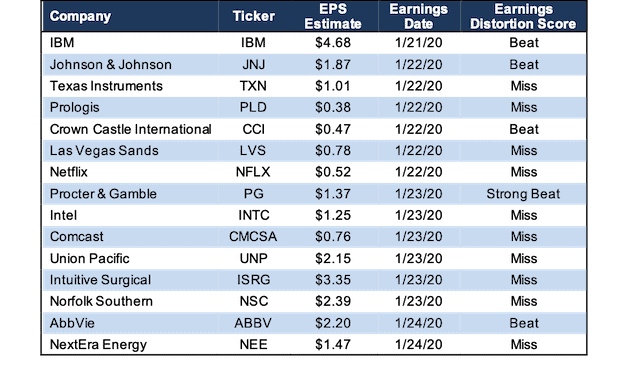
Sources: New Constructs, LLC and company filings
The appendix to this report shows all the S&P 500 companies, plus those with market caps greater than $10 billion, that report earnings the week of January 20, 2020.
Details: PG’s Earnings Distortion
Over the trailing twelve months (TTM) period, Procter & Gamble (PG: $124/share) had -$7.4 billion in net earnings distortion that cause earnings to be understated. Notable unusual expenses buried in the fine print of the firm’s 2019 10-K include:
- $8.3 billion in goodwill impairment charges, $8 billion after-tax – Page 35 and Page 44
- $754 million in restructuring expense – Page 45
The pre-tax value for the impairment charge was disclosed directly on the income statement, but the after-tax value could only be found by reading through the footnotes.
These unusual expenses were offset by some non-operating income items, most notably a $353 million after-tax gain on the sale of assets (Page 12).
In total, we identified $2.91/share (184% of reported EPS) in net unusual expenses in PG’s TTM results. After removing this earnings distortion from GAAP net income, we see that PG’s TTM core earnings of $4.49/share are significantly above its GAAP EPS of $1.58.
The analyst consensus for PG’s Q2 earnings is $1.37/share. Investors who only look at GAAP net income will think that analysts are projecting PG to earn almost as much this quarter as it did in the entire previous year. By removing earnings distortion, we see that consensus estimates imply much more modest annualized year-over-year growth of 22%, compared to the 247% growth implied by the unadjusted numbers for Q2. See Figure 2.
Figure 2: PG Core Earnings Vs. GAAP: 2016-Q2 2020
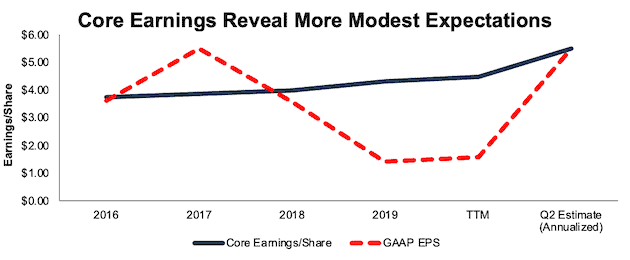
Sources: New Constructs, LLC and company filings
Figure 1 shows that PG is the only company to earn our “Strong Beat” rating for the week of 1/20/20. Four other companies earn our “Beat” rating, which means we think they will beat expectations, but we’re not as confident as we are with PG. 10 companies in Figure 1 earn a “Miss” rating.
How to Make Money with Earnings Distortion Data
“Trading strategies that exploit {adjustments provided by New Constructs} produce abnormal returns of 7-to-10% per year.” – Page 1 in Core Earnings: New Data & Evidence
In Section 4.3 of Core Earnings: New Data and Evidence, professors from HBS & MIT Sloan present a long/short strategy that holds the stocks with the most understated EPS and shorts the stocks with the most overstated earnings. Positions are opened in the month each 10-K is filed and held until the next 10-K is filed, or about a year.
This simple, low turnover strategy produced abnormal returns of 7-to-10% a year. These abnormal returns show that the market misses important data in the footnotes and that investors who adjust for unusual items can make more money. Click here for more details on our data offerings.
For more on how to use core earnings and earnings distortion to pick better stocks, click here.
This article originally published on January 13, 2020.
Disclosure: David Trainer, Kyle Guske II, and Sam McBride receive no compensation to write about any specific stock, sector, style, or theme.
Follow us on Twitter, Facebook, LinkedIn, and StockTwits for real-time alerts on all our research.
Appendix: All Major Companies That Report January 20-24
Figure 3 shows all the S&P 500 companies, plus those with market caps greater than $10 billion, that report earnings the week of January 20, 2020.
Figure 3: Earnings Distortion Scorecard: Week of 1/20/20-1/24/20
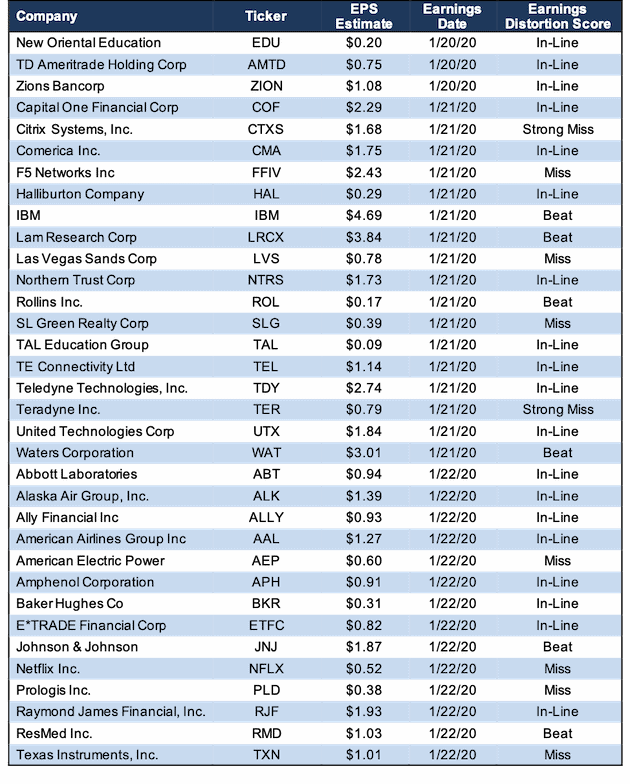
Sources: New Constructs, LLC and company filings
Figure 3: Earnings Distortion Scorecard: Week of 1/20/20-1/24/20 (continued)
Sources: New Constructs, LLC and company filings
[1] Note that Earnings Distortion scores will be added to our website via a new column on the Screeners and Portfolios page in January 2020.