
Sector Analysis 4Q16
The Energy sector ranks last out of the ten sectors as detailed in our 4Q16 Sector Ratings for ETFs and Mutual Funds report. Last quarter, the Energy sector ranked ninth. It gets our Dangerous rating, which is based on aggregation of ratings of 22 ETFs and 102 mutual funds in the Energy sector as of October 11, 2016. See a recap of our 3Q16 Sector Ratings here.
Figures 1 and 2 show the five best and worst rated ETFs and mutual funds in the sector. Not all Energy sector ETFs and mutual funds are created the same. The number of holdings varies widely (from 25 to 142). This variation creates drastically different investment implications and, therefore, ratings.
Investors should not buy any Energy ETFs or mutual funds because none get an Attractive-or-better rating. If you must have exposure to this sector, you should buy a basket of Attractive-or-better rated stocks and avoid paying undeserved fund fees. Active management has a long history of not paying off.
Figure 1: ETFs with the Best & Worst Ratings – Top 5

* Best ETFs exclude ETFs with TNAs less than $100 million for inadequate liquidity.
Sources: New Constructs, LLC and company filings
Five ETFs are excluded from Figure 1 because their total net assets (TNA) are below $100 million and do not meet our liquidity minimums. See our ETF screener for more details.
Figure 2: Mutual Funds with the Best & Worst Ratings – Top 5

* Best mutual funds exclude funds with TNAs less than $100 million for inadequate liquidity.
Sources: New Constructs, LLC and company filings
Tortoise North American Energy Fund (TNPIX) and Select Opportunity Fund (TOPIX) are excluded from Figure 2 because their total net assets (TNA) are below $100 million and do not meet our liquidity minimums.
PowerShares Water Resources Portfolio (PHO) is the top-rated Energy ETF and Fidelity Energy Service Portfolio (FSESX) is the top-rated Energy mutual fund. PHO earns a Neutral rating and FSESX earns a Dangerous rating.
PowerShares Dynamic Energy Portfolio (PXE) is the worst rated Energy ETF and Rydex Energy Services Fund (RYESX) is the worst rated Energy mutual fund. PXE earns a Dangerous rating and RYESX earns a Very Dangerous rating.
171 stocks of the 3000+ we cover are classified as Energy stocks.
DHT Holdings Inc. (DHT: $4/share) is one of our favorite stocks held by Energy ETFs and mutual funds and earns a Very Attractive rating. DHT is also on this month’s Most Attractive Stocks list. Since 2009, DHT has grown after-tax profit (NOPAT) by 22% compounded annually to $136 million in 2015. Over the last twelve months, NOPAT has grown to $166 million. The company’s return on invested capital (ROIC) has improved from 10% in 2009 to 12% over the last twelve months. Despite the impressive profit growth, DHT is significantly undervalued. With margins reaching levels last seen in 2009, it’s understandable to expect some reversion to the mean. However, at its current price of $4/share, DHT has a price-to-economic book value (PEBV) of 0.2. This ratio means that the market expects DHT’s NOPAT to permanently decline by 80%. If DHT can limit NOPAT contraction to just a 2% compounded annual decrease over the next decade, the stock is worth $6/share today – a 50% upside.
Golden Ocean Group Limited (GOGL: $4/share) is one of our least favorite stocks held by Energy ETFs and mutual funds and earns a Dangerous rating. Over the past decade, GOGL’s NOPAT has declined from $48 million in 2005 to -$57 million in 2015. The company’s ROIC has fallen from a once impressive 15% in 2005 to a bottom-quintile -3% in 2015. Despite the issues noted above, GOGL remains priced for significant profit growth. To justify its current price of $4/share, GOGL must immediately achieve 6% NOPAT margins (compared to -30% in 2015) and grow revenue by 19% compounded annually for the next 16 years. These expectations seem overly optimistic given the profit decline over the past decade. This scenario also assumes GOGL is able to grow revenue and NOPAT without spending on working capital or fixed assets, which is unlikely but allows us to create a very optimistic scenario. For reference, GOGL’s invested capital has grown on average $205 million (>100% of 2015 revenue) over the last 10 years.
Figures 3 and 4 show the rating landscape of all Energy ETFs and mutual funds.
Figure 3: Separating the Best ETFs From the Worst ETFs
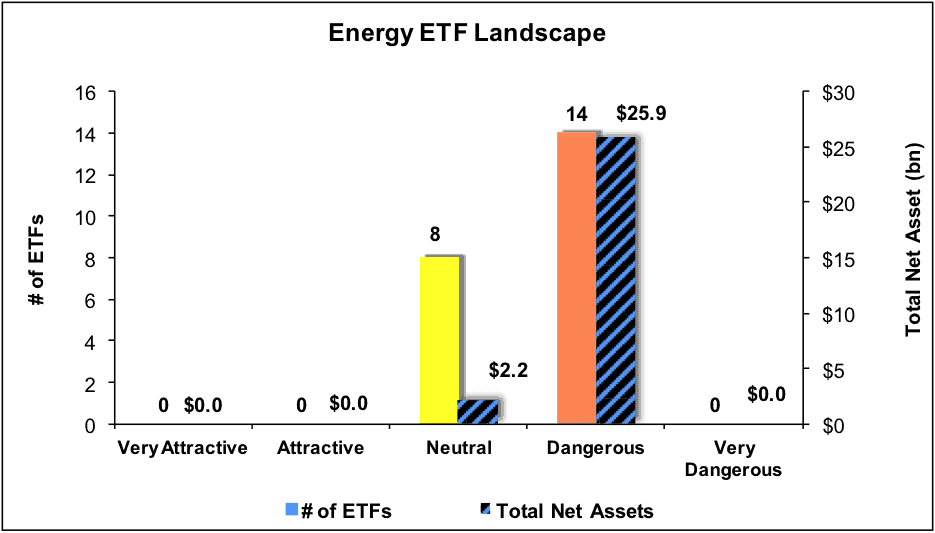
Sources: New Constructs, LLC and company filings
Figure 4: Separating the Best Mutual Funds From the Worst Mutual Funds
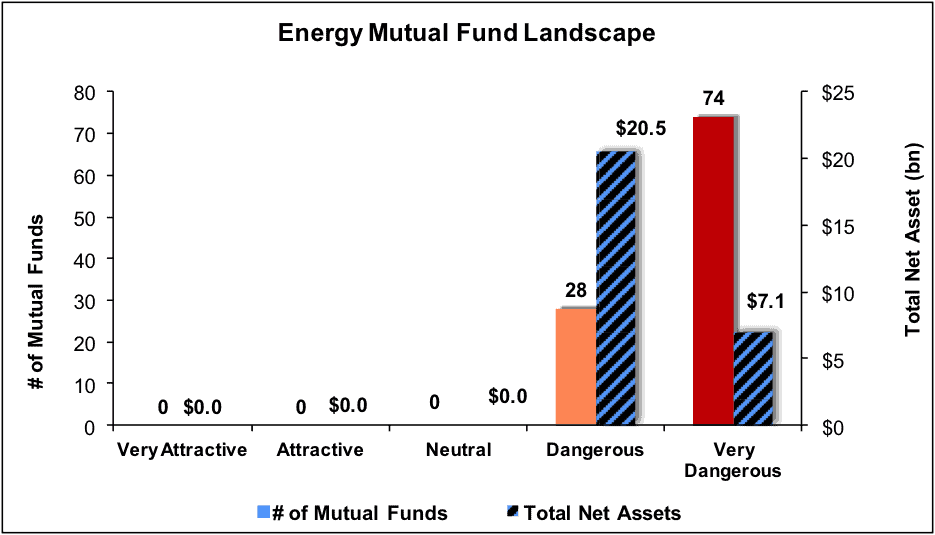
Sources: New Constructs, LLC and company filings
This article originally published here on October 11, 2016.
David Trainer and Kyle Martone receive no compensation to write about any specific stock, sector or theme.
Click here to download a PDF of this report.
Photo Credit: Geof Wilson (Flickr)