Six new stocks make our Safest Dividend Yield Model Portfolio this month, which was made available to members on August 22, 2018.
Recap from July’s Picks
The best performing large cap stock in the portfolio was up 13% and the best performing small cap stock was up 13% as well. Overall, 10 out of the 20 Safest Dividend Yield stocks outperformed the S&P in July.
Since inception, this Model Portfolio is up 21% on a price return basis (S&P +31%) and 31% on a total return basis (S&P +34%).
This Model Portfolio leverages our Robo-Analyst technology[1], which scales our forensic accounting expertise (featured in Barron’s) across thousands of stocks.[2]
This Model Portfolio only includes stocks that earn an Attractive or Very Attractive rating, have positive free cash flow and economic earnings, and offer a dividend yield greater than 3%. Companies with strong free cash flow provide higher quality and safer dividend yields because we know they have the cash to support the dividend. We think this portfolio provides a uniquely well-screened group of stocks that can help clients outperform.
Featured Stock for August: General Motors (GM: $36/share)
General Motors, (GM) is the featured stock in August’s Safest Dividend Yields Model Portfolio. General Motors was previously featured as a Long Idea in March 2018, and recently featured in our article “Micro-Bubble Winners.”
Since 2012, GM has grown after-tax profit (NOPAT) from $3.9 billion to $7.1 billion over the trailing twelve months. Over the same time, NOPAT margin has improved from 2.5% in 2012 to 5.1% TTM while its return on invested capital (ROIC) improved from 6% to 9%. The company has generated free cash flow of $24 billion (47% of current market cap) over the past five years.
GM’s Free Cash Flow Supports Dividend Payments
Over the past five years, GM has increased its annual dividend from $0/share to $1.52/share. This dividend payment is easily covered by GM’s impressive free cash flow. Since 2013, GM has generated $24 billion in free cash flow while paying $8.8 billion in dividends. Over the TTM period, GM generated $3.2 billion in FCF and paid $2.2 billion in dividends.
Companies with strong free cash flow provide higher quality dividend yields because we know the firm has the cash to support its dividend. On the flip side, dividends from companies with low or negative free cash flow cannot be trusted as much because the company may not be able to sustain paying dividends.
Figure 1: GM’s FCF vs. Dividends Since 2014
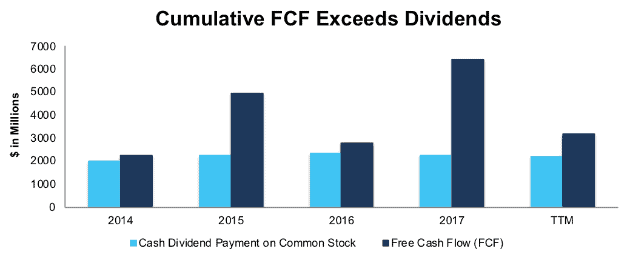
Sources: New Constructs, LLC and company filings
GM Valuation Implies Massive Profit Decline
As we noted in our Long Idea, GM’s current stock price implies that its NOPAT will fall off a cliff. At its current price of $36/share, GM has a price-to-economic book value (PEBV) ratio of 0.6. This ratio means the market expects GM’s NOPAT to permanently decline by 40%. For the stock to do well, GM’s cash flows just need to be better than what the market expects.
GM’s economic book value, or no-growth value, is $61/share – a 69% upside from the current price.
Even if GM can maintain current margins and grow NOPAT by just 1% compounded annually for the next decade, the stock is worth $70/share today – a 94% upside. See the math behind this dynamic DCF scenario.
Critical Details Found in Financial Filings by Our Robo-Analyst Technology
As investors focus more on fundamental research, research automation technology is needed to analyze all the critical financial details in financial filings. Below are specifics on the adjustments we make based on Robo-Analyst findings in General Motors’ 2017 10-K:
Income Statement: we made $29.6 billion of adjustments with a net effect of removing $12.4 billion in non-operating expenses (8% of revenue). See all adjustments made to GM’s income statement here.
Balance Sheet: we made $79.8 billion of adjustments to calculate invested capital with a net decrease of $2.5 billion. The most notable adjustment was $26 billion (33% of reported net assets) related to asset write-downs. See all adjustments to GM’s balance sheet here.
Valuation: we made $53 billion of adjustments with a net effect of decreasing shareholder value by $23 billion. The largest adjustment to shareholder value was $20.5 billion related to underfunded pensions. This adjustment represents 40% of GM’s market value.
This article originally published on August 28, 2018.
Disclosure: David Trainer, Kyle Guske II, and Sam McBride receive no compensation to write about any specific stock, style, or theme.
Follow us on Twitter, Facebook, LinkedIn, and StockTwits for real-time alerts on all our research.
[1] Harvard Business School features the powerful impact of our research automation technology in the case New Constructs: Disrupting Fundamental Analysis with Robo-Analysts.
[2] Ernst & Young’s recent white paper “Getting ROIC Right” proves the superiority of our holdings research and analytics.
Click here to download a PDF of this report.
Photo Credit: Geralt (Pixabay)