
Executives respond to the incentives placed in front of them – it’s human nature.
An executive compensation plan that focuses only on the wrong metrics, those that do not reflect the underlying economics of the business, will likely lead executives to do bad things to the underlying business and destroy shareholder value.
By contrast, compensation structures based on metrics proven to create shareholder value, particularly return on invested capital (ROIC), will likely lead executives to do good things for shareholders.
Our Exec Comp Aligned with ROIC Model Portfolio includes only those stocks that (1) receive an Attractive-or-better rating and (2) directly link executive compensation to ROIC (or similar variations). We believe this combination signals disciplined capital allocation and strong upside potential.
We are proud to offer the Exec Comp Aligned with ROIC Model Portfolio, and we are excited to give you a free stock pick from this Model Portfolio.
The goal behind sharing these free stock picks with you is to deliver insight into the uniquely high value-add of our research that leverages the most reliable AI Agent for investing in the world. Learn more about our AI Agent that combines our proven superior data and research with Google Cloud’s technology here.
We update this Model Portfolio monthly, and September’s Exec Comp Aligned with ROIC Model Portfolio was updated and published for clients on September 16, 2025.
Free Stock Pick for September: Korn Ferry (KFY: $72/share)
Korn Ferry has grown revenue and net operating profit after-tax (NOPAT) by 10% and 11% compounded annually, respectively, since fiscal 2015. The company’s NOPAT margin improved from 8.6% in fiscal 2015 to 9.7% in the TTM, while invested capital turns remained at 1.4 over the same time. Rising NOPAT margin drives return on invested capital (ROIC) from 12% in fiscal 2015 to 14% in the TTM.
Figure 1: Korn Ferry’s Revenue & NOPAT: 2015 – TTM
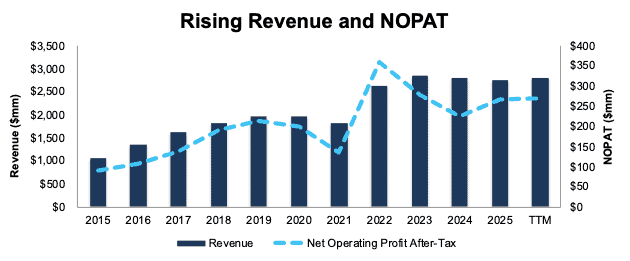
Sources: New Constructs, LLC and company filings
Executive Compensation Properly Aligns Incentives
Korn Ferry’s executive compensation plan aligns the interests of executives and shareholders by including adjusted ROIC as one of four financial metrics used in determining executives’ annual cash incentives. In fact, Korn Ferry outlines in its proxy statement that one of the most important metrics for its stockholders is “the Company’s ability to allocate and deploy capital effectively so that its return on invested capital exceeds the Company’s cost of capital.”
The company’s inclusion of ROIC has helped create shareholder value by driving higher ROIC and economic earnings. When we calculate Korn Ferry’s ROIC using our superior fundamental data, we find that it has increased from 12% in fiscal 2015 to 14% in the TTM. Economic earnings rose from $51 million to $118 million over the same time. See Figure 2.
Figure 2: Korn Ferry’s Economic Earnings: 2015 – TTM
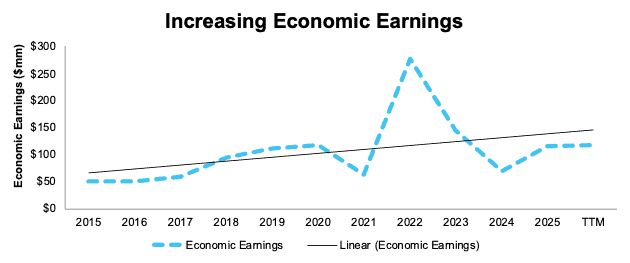
Sources: New Constructs, LLC and company filings
KFY Has Further Upside
At its current price of $72/share, KFY has a price-to-economic book value (PEBV) ratio of 1.1. This ratio means the market expects Korn Kerry’s NOPAT to grow no more than 10% from TTM levels. This expectation seems overly pessimistic for a company that has grown NOPAT 6% and 11% compounded annually over the last five and 10 years, respectively.
Even if Korn Ferry’s:
- NOPAT margin remains at 9.7% (equal to both five-year average and TTM NOPAT margin) through fiscal 2034,
- revenue grows at consensus rates in fiscal 2026 (3%), fiscal 2027 (4%), and fiscal 2028 (5%) and
- revenue grows at 5% (below 5-year CAGR of 7% and 10-year CAGR of 10%) each year thereafter through fiscal 2035, then,
the stock would be worth $88/share today – a 22% upside. In this scenario, Korn Ferry’s NOPAT would grow 5% compounded annually through fiscal 2035. Contact us for the math behind this reverse DCF scenario.
Critical Details Found in Financial Filings by Our Robo-Analyst Technology
Below are specifics on the adjustments we made based on Robo-Analyst findings in Korn Ferry’s 10-K and 10-Qs:
Income Statement: we made over $75 million in adjustments with a net effect of removing over $30 million in non-operating expense. Professional members can see all adjustments made to the company’s income statement on the GAAP Reconciliation tab on the Ratings page on our website.
Balance Sheet: we made nearly $1.9 billion in adjustments to calculate invested capital with a net decrease of under $1.2 billion. The most notable adjustment was for deferred compensation. Professional members can see all adjustments made to the company’s balance sheet on the GAAP Reconciliation tab on the Ratings page on our website.
Valuation: we made over $1.8 billion in adjustments with a net decrease to shareholder value of nearly $50 million. The most notable adjustment to shareholder value was excess cash. Professional members can see all adjustments to the company’s valuation on the GAAP Reconciliation tab on the Ratings page on our website.
This article was originally published on September 26, 2025.
Disclosure: David Trainer, Kyle Guske II, and Hakan Salt receive no compensation to write about any specific stock, style, or theme.
Questions on this report or others? Join our online community and connect with us directly.