Earnings season is drawing to a close, but not without a bang. This period is among the most headline-driven in the market, with hype, momentum, and narratives often overshadowing the underlying data.
To help cut through the noise, we host weekly earnings watch parties to analyze what earnings and corporate results truly reveal about a company’s fundamentals amid prevailing market trends. Watch the replay of this week’s earnings watch party here.
Additionally, in these earnings watch parties we provide insights into our Stock Ratings, which generate real alpha, as proven by outperformance of the Very Attractive Stocks Index (ticker: BNCVA1T:IND).
To give you access to this alpha, we are sharing a free stock pick from our Most Attractive Stocks Model Portfolio. This Model Portfolio identifies the best stocks in the market, i.e. the stocks that are not only undervalued but also possess strong fundamentals.
This pick comes with a concise summary, not a full Long Idea report. The summary provides insight into the rigor of our research and approach to picking stocks. Whether you’re a subscriber or not, we think it is important, especially in today’s volatile market environment, that you’re able to see our research on stocks. We’re proud to share our work, and we want to help investors when they need it most.
Keep an eye out for the free pick from our Most Dangerous Stocks Model Portfolio, which will be published this week as well!
We hope you enjoy this research. Feel free to share with friends and colleagues!
We update this Model Portfolio monthly. The latest Most Attractive and Most Dangerous stocks Model Portfolios were updated and published for clients on August 6, 2025.
Free Most Attractive Stocks Pick: Pilgrim’s Pride Corp (PPC)
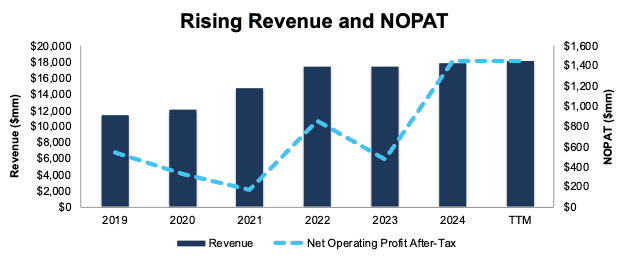
Pilgrim’s Pride (PPC: $48/share) has grown revenue and net operating profit after tax (NOPAT) by 9% and 20% compounded annually since 2019, respectively. Pilgrim’s Pride’s NOPAT margin increased from 5% in 2019 to 8% in the trailing-twelve months (TTM), while its invested capital turns rose from 1.9 to 2.2 over the same time. Rising NOPAT margins and invested capital turns drive Pilgrim’s Pride’s return on invested capital (ROIC) from 9% in 2019 to 18% in the TTM.
Figure 1: Pilgrim’s Pride’s Revenue and NOPAT Since 2019
Sources: New Constructs, LLC and company filings
PPC Is Undervalued
At its current price of $48/share, PPC has a price-to-economic book value (PEBV) ratio of 0.5. This ratio means the market expects Pilgrim’s Pride’s NOPAT to permanently decline by 50% from TTM levels. This expectation seems overly pessimistic for a company that has grown NOPAT by 20% compounded annually over the last five years and 6% compounded annually over the last ten years.
Even if Pilgrim’s Pride’s NOPAT margin falls to 5% (compared to 8% in the TTM) and the company grows revenue by 3% (below ten-year CAGR of 7%) compounded annually through 2034, the stock would be worth $66/share today – a 38% upside. In this scenario, Pilgrim’s Pride’s NOPAT would fall 2% compounded annually through 2034. Contact us for the math behind this reverse DCF scenario.
Should Pilgrim’s Pride grow profits more in line with historical levels, the stock has even more upside.
Critical Details Found in Financial Filings by Our Robo-Analyst Technology
Below are specifics on the adjustments we made based on Robo-Analyst findings in Pilgrim’s Pride’s 10-K and 10-Q:
Income Statement: we made over $600 million in adjustments, with a net effect of removing over $300 million in non-operating expense. Professional members can see all adjustments made to the company’s income statement on the GAAP Reconciliation tab on the Ratings page on our website.
Balance Sheet: we made over $2 billion in adjustments to calculate invested capital with a net increase of just under $200 million. One of the most notable adjustments was for asset write downs. Professional members can see all adjustments made to the company’s balance sheet on the GAAP Reconciliation tab on the Ratings page on our website.
Valuation: we made just over $4 billion in adjustments to shareholder value, with a net decrease of around $4 billion. Apart from total debt, the most notable adjustment was for deferred tax liabilities. Professional members can see all adjustments to the company’s valuation on the GAAP Reconciliation tab on the Ratings page on our website.
This article was originally published on August 15, 2025.
Disclosure: David Trainer, Kyle Guske II, and Hakan Salt receive no compensation to write about any specific stock, style, or theme.
Questions on this report or others? Join our online community and connect with us directly.

