
Today’s market is increasingly defined by trade uncertainty, irrational buying (meme stocks anyone?), and record valuations. With this backdrop, income investors seek refuge in dividend stocks. However, not all dividend stocks are safe dividend stocks. For instance, Dow (DOW), even with its multi-billion-dollar market cap, recently halved its dividend from $0.70/share to $0.35/share.
Many high-yield stocks may, in fact, be masking underlying financial weaknesses. Without ample free cash flow generation, companies cannot maintain their dividend commitments. Dividend cuts tend to have devastating impacts on stock prices. From the example above, DOW is down over 20% since it cut its dividend.
The key to identifying good dividend stocks lies in robust fundamental research. A company must demonstrate the capacity to generate sufficient and consistent cash flows to support its dividend policy over time. Without this financial foundation, even the most attractive yields can prove illusory.
Our Safest Dividend Yields Model Portfolio provides you with the best of the dividend stocks. How?
It includes only Attractive or Very Attractive rated stocks whose underlying businesses generate sufficient cash flows to support dividend payments. In other words, we give you the best of both worlds: safety and upside potential.
Below you will find a free stock pick from the latest edition of our Safest Dividend Yields Model Portfolio. This summary is not a full Long Idea report, but it will give you insight into the rigor of our research and approach to picking stocks.
Feel free to share this report with friends and colleagues.
We update this Model Portfolio monthly. July’s Safest Dividend Yields Model Portfolio was updated and published for clients on July 23, 2025.
Free Stock Pick: Verizon Communications (VZ: $43/share)
Verizon Communications (VZ) is the featured stock in July’s Safest Dividend Yields Model Portfolio.
Verizon Communications has grown revenue and net operating profit after tax (NOPAT) by 1% and 2% compounded annually, respectively, since 2014 while invested capital turns fell from 0.5 to 0.3 over the same time. As a result, the company’s return on invested capital (ROIC) has fallen from 7.5% in 2014 to 6% in the TTM, but what it lacks in ROIC improvement, it more than makes up for in FCF generation.
Figure 1: Verizon Communications’ Revenue & NOPAT Since 2014
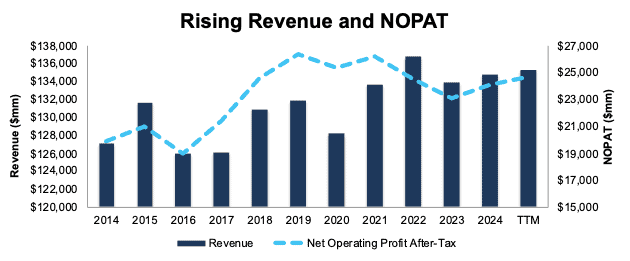
Sources: New Constructs, LLC and company filings
Free Cash Flow Exceeds Regular Dividend Payments
Verizon Communications has increased its regular dividend from $0.62/share in 3Q20 to $0.68/share in 3Q25. The current quarterly dividend, when annualized provides a 6.4% dividend yield.
The company’s free cash flow (FCF) easily exceeds its regular dividend payments. From 2022 through the first half of 2025 (1H25), the company generated $61.9 billion (15% of current enterprise value) in FCF while paying $38.8 billion in regular dividends. See Figure 2.
Figure 2: Verizon Communications’ FCF Vs. Regular Dividends Since 2022
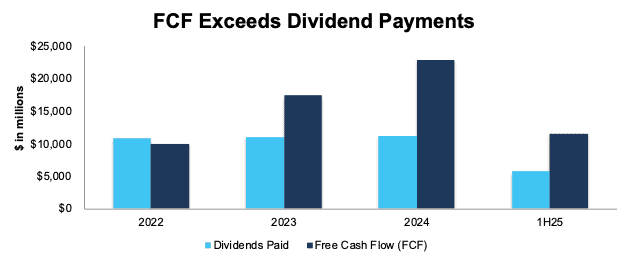
Sources: New Constructs, LLC and company filings
As Figure 2 shows, this company’s dividends are backed by a history of reliable cash flows. Dividends from companies with low or negative FCF are less dependable since the company might not be able to sustain paying dividends.
VZ Is Undervalued
At its current price of $43/share, VZ has a price-to-economic book value (PEBV) ratio of 0.7. This ratio means the market expects the company’s NOPAT to permanently fall 30% from TTM levels. This expectation seems overly pessimistic given that the company has grown NOPAT by 1% compounded annually over the last ten years and 3% compounded annually over the last 20 years.
Even if the company’s:
- NOPAT margin immediately falls to 17.5% (compared to 10-year average of 17.9%) through 2034, and
- revenue grows just 1% (equal to CAGR over past decade) compounded annually through 2034, then
the stock would be worth $64/share today – a 49% upside. In this scenario, the company’s NOPAT would grow just 1% compounded annually through 2034. Contact us for the math behind this reverse DCF scenario.
Should the company’s NOPAT grow more in line with historical growth rates, the stock has even more upside.
Critical Details Found in Financial Filings by Our Robo-Analyst Technology
Below are specifics on the adjustments we make based on Robo-Analyst findings in this featured stock’s 10-K and 10-Qs:
Income Statement: we made over $14 billion in adjustments with a net effect of removing just under $7 billion in non-operating expenses. Professional members can see all adjustments made to the company’s income statement on the GAAP Reconciliation tab on the Ratings page on our website.
Balance Sheet: we made over $190 billion in adjustments to calculate invested capital with a net increase of just over $95 billion. One of the most notable adjustments was for accumulated asset write-downs. Professional members can see all adjustments made to the company’s balance sheet on the GAAP Reconciliation tab on the Ratings page on our website.
Valuation: we made over $228 billion in adjustments to shareholder value, with a net decrease of over $227 billion. Apart from total debt, the most notable adjustment to shareholder value was for deferred tax liabilities. Professional members can see all adjustments to the company’s valuation on the GAAP Reconciliation tab on the Ratings page on our website.
This article was originally published on August 4, 2025.
Disclosure: David Trainer, Kyle Guske II, and Hakan Salt receive no compensation to write about any specific stock, style, or theme.
Questions on this report or others? Join our online community and connect with us directly.