
The United States is fully immersed in summer this week with scorching temperatures driving air conditioners into overdrive. A powerful heat dome has enveloped much of the country, pushing temperatures into the triple digits across 28 states, triggering everything from the activation of cooling centers to emergency protocols for the power grid. This extreme weather event serves as a vivid reminder of how environmental factors, entirely outside of our control, can ripple through the economy and investor sentiment alike.
Meanwhile, geopolitical tensions remain front and center on the global stage. At the recent NATO summit, member nations committed to increasing defense spending to 5% of GDP by 2035, which signals a significant shift toward bolstered military readiness. With both Europe and the United States reinforcing defense postures, the international security landscape appears to be entering a more assertive and dynamic phase.
In such a charged environment, maintaining a cool and clear-headed approach to investing is essential. When headlines and market narratives have the power to sway emotions, rigorous and disciplined research becomes indispensable for investors focused on long-term success. After all, while the war drums are beating around the world, thoughtful decision-making remains the best way to navigate the markets.
Our latest Long Idea helps you do just that. The business benefits from long-term industry tailwinds and operational efficiency advantages. It returns significant capital to shareholders, and, best of all, its stock trades at a steep discount.
We first made Suncor Energy (SU: $38/share) a Long Idea in April 2023. Since our original report, the stock is up less than the S&P 500 even as the business generated billions in profits. After the company beat on the bottom-line but missed top-line 1Q25 estimates, our thesis remains intact, and this stock provides quality upside potential.
SU still offers favorable Risk/Reward based on the company’s:
- long-term tailwinds in energy,
- asset efficiency and reserve life advantages,
- improving fundamentals,
- high capital return backed by ample cash flows,
- strong balance sheet, and
- undervalued stock price.
What’s Working
Long-Term Energy Demand is on the Rise, Oil is Still King
While global energy demand will surely peak at some point, the fact remains that it is expected to rise through at least 2050. At the same time, the share of oil and gas in the energy mix is expected to stay above 53% (oil at 29% and gas at 24%) through 2050.
OPEC’s latest World Oil Outlook forecasts global primary energy to increase from 301 barrels of oil equivalent a day (mboe/d) in 2023 to 374 mboe/d in 2050, an increase of 24%. The three fuel types that are expected to see the largest increase in demand from 2023 through 2050 are renewables (43 mboe/d), gas (21 mboe/d), and oil (17 mboe/d). Suncor, as a leading renewable and oil provider, is positioned to benefit from this long-term trend for years to come.
Figure 1: Growth in Global Energy Demand by Fuel Type: 2023 – 2050
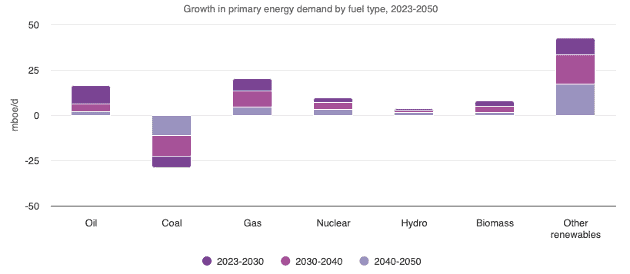
Sources: OPEC
Longer Reserve Life and Superior Efficiencies
Suncor possesses a competitive advantage over other integrated oil and gas companies: it operates in oil sands instead of oil shales. Suncor’s oil sand operations have a much longer a reserve life compared to oil shales. For instance, Suncor’s oil sands reserve life sits at 25 years. Competitors, including BP, PLC (BP), Shell (SHEL), and TotalEnergies (TTE) have reserve lives of 7, 8, and 11 years, respectively.
Not only does Suncor have longer reserve life, but it is consistently improving its ability to extract and process that oil and gas.
Suncor’s average annual refinery utilization rate consistently ranks above both U.S. and Canadian averages for the last decade. In fact, the company’s average annual refinery utilization rate increased from 90% in 2023 to 100% in 2024. This improvement is a result of both record refinery utilization rates and record production across multiple facilities. See Figure 2.
At its most basic level, utilization first begins with the ability to get material to refineries. Suncor excels in this regard because its facilities are connected directly via pipeline to both mining and in situ oil sand assets. The company also maintains direct access to different feedstocks via rail and marine, as well as the ability to process multiple crude types (depending upon facility).
Figure 2: Suncor’s Average Annual Utilization Rate vs. Industry Averages: 2015 – 2024
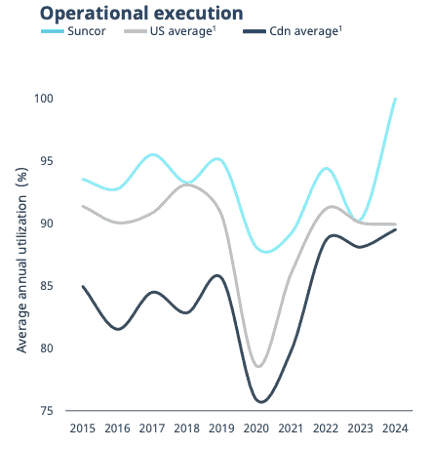
Sources: Suncor 1Q25 Presentation, New Constructs, LLC and company filings
Leading in Profitability as Well
Suncor’s superior operational efficiencies manifest in the company’s top-tier profitability. Suncor is the most profitable integrated energy company across the globe, among publicly traded competitors.
Over the TTM, Suncor has the highest return on invested capital (ROIC) and second highest net operating profit after-tax (NOPAT) margin among competitors, which include TotalEnergies (TTE), Shell (SHEL), Exxon Mobil (XOM), Chevron Corp (CVX), and more. See Figure 3.
Figure 3: Suncor’s Profitability Vs. Peers: TTM
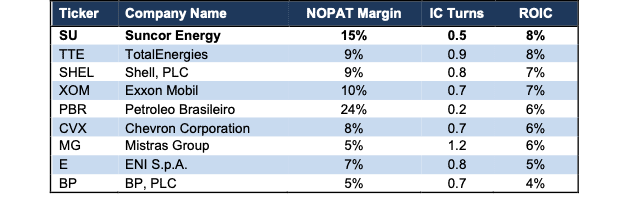
Sources: New Constructs, LLC and company filings
Improving Fundamentals
Rising demand, improving efficiency, and high margins result in Suncor achieving growth across both the top and bottom-line. In fact, the company has grown revenue and NOPAT by 3% and 5% compounded annually since 2019 (pre-COVID).
The company improved its NOPAT margin from 14% in 2019 to 15% in the TTM while invested capital turns rose from 0.4 to 0.5 over the same time. Rising NOPAT margins and invested capital turns drive the company’s ROIC from 6% in 2019 to 8% in the TTM ended 1Q25.
Additionally, the company’s Core Earnings, a superior and cleaner earnings measure, grew 7% compounded annually from $3.3 billion in 2019 to $4.7 billion in the TTM.
Figure 4 shows Suncor’s revenue and NOPAT growth from 2015-TTM.
Figure 4: Suncor’s Revenue and NOPAT: 2015 – TTM
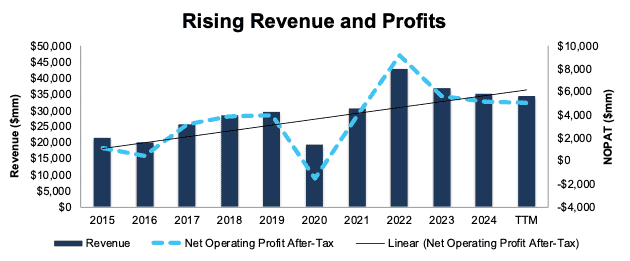
Sources: New Constructs, LLC and company filings
Potential for 9%+ Yield
Since 2021, Suncor has paid $7.7 billion (15% of market cap) in dividends and has increased its quarterly dividend from $0.17/share in 1Q21 to $0.42/share in 2Q25. The company’s current dividend, when annualized, provides a 4.3% yield.
Suncor also returns capital to shareholders through share repurchases. Since 2021, Suncor repurchased $9.9 billion (20% of market cap) worth of shares. During the first three months of 2025, the company repurchased $555 million worth of shares.
The company renewed its annual normal course issuer bid (NCIB) for 2025, which allows the company to repurchase 10% of its shares outstanding. Should the company repurchase shares at the TTM pace through the next year, it would repurchase $2.4 billion of shares, which is 4.7% of the company’s current market cap. When combined, the dividend and share repurchase yield could reach 9.0%.
Strong Cash Flows Support Shareholder Return
Investors should take comfort in knowing Suncor will be able to afford to pay its dividends and repurchase shares due to its large free cash flow (FCF) generation. From 2021 through 1Q25, Suncor generated $29.5 billion in FCF, which equals 46% of the company’s enterprise value.
Figure 5: Suncor’s Cumulative Free Cash Flow: 2021 – 1Q25
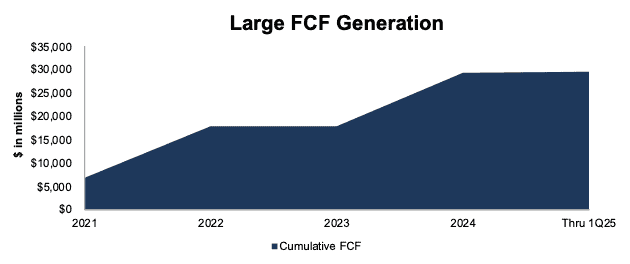
Sources: New Constructs, LLC and company filings
Suncor’s $29.5 billion in FCF since 2021 is more than enough to cover its $17.5 billion in combined dividend payments ($7.7 billion) and share repurchases ($9.9 billion).
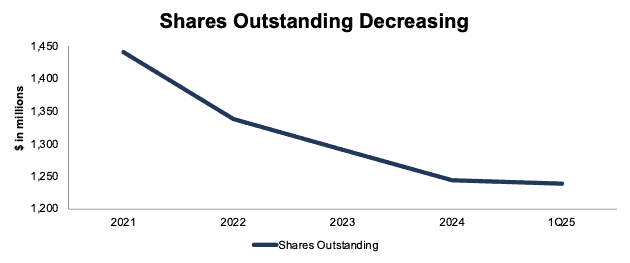
Suncor’s repurchases have also meaningfully reduced its shares outstanding from 1.4 billion in 2021 to 1.2 billion in 1Q25. See Figure 6.
We like companies that choose to return capital to shareholders instead of spending it on costly acquisitions or executive bonuses that rarely drive shareholder value creation.
In addition, reductions in shares outstanding tend to ensure capital appreciation for investors no matter how growth or momentum crazed the overall market it. In other words, companies that sport strong enough cash flows that enable them to consistently lower their shares outstanding offer excellent value.
Figure 6: Suncor’s Shares Outstanding: 2021 – 1Q25
Sources: New Constructs, LLC and company filings
Strong Balance Sheet and Credit Rating to Weather Uncertainty
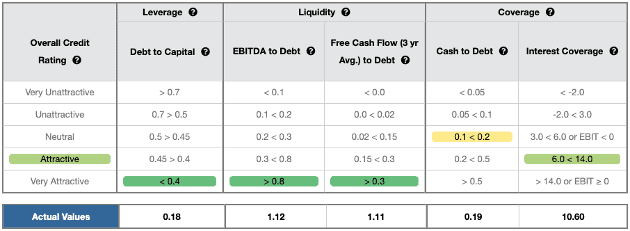
Suncor has also leveraged its strong cash flow generation to improve its balance sheet. The company has decreased its total debt from $17.0 billion in 2020 to $10.2 billion in the TTM. Over the same time, cash and equivalents increased from $1.5 billion to $2.4 billion.
Suncor earns an Attractive overall Credit Rating and scores an Attractive-or-better rating in four of the five credit rating metrics. See Figure 7.
Even if economic conditions deteriorate, demand fluctuates, or oil prices fluctuate due to the war in the middle east, the company’s strong financial footing secures its operations for the foreseeable future.
Figure 7: Suncor’s Credit Rating Details
Sources: New Constructs, LLC and company filings
What’s Not Working
War Might Result in Further Price Volatility
War drums in the middle east and around the world are knocking oil prices all over the place these days. Oil prices increased nearly 20% from the beginning of June through Friday June 20, largely due to fears that Iran could close the Strait of Hormuz, which accounts for ~20% of global oil and gas transportation.
However, these worries have abated for now with the announcement of a ceasefire between both Isreal and Iran. Brent crude prices fell ~6% on Monday June 23 from Friday June 20 closing prices.
Had Iran closed Hormuz in retaliation, oil prices were expected to surpass $100 per barrel, a stark increase from $75/barrel before the ceasefire announcement and ~$60/barrel at the beginning of June.
The price volatility comes on the heels of falling oil prices for much of 2025. In mid-May, Brent crude prices were down over 25% from their early January highs. The plummeting price could be attributed to OPEC’s decision to heavily increase production in May, June, and July of this year.
The good news for Suncor investors is that the company has been lowering its crude oil breakeven price for years. In 2024, the company achieved a $7/barrel West Texas Intermediate (WTI) breakeven reduction, and its overall breakeven sits ~$45/barrel. Suncor even includes its dividend in its breakeven calculation to ensure it’s able to return capital to shareholders throughout price cycles.
Best of all, any potential further decline in oil prices is already more than priced into Suncor’s current valuation, as we’ll show below.
Current Price Implies Profits Will Permanently Fall by 20%
At its current price of $38/share, SU has a price-to-economic book value (PEBV) ratio of 0.8. This ratio means the market expects the company’s NOPAT to permanently decline 20% from TTM levels. This expectation seems overly pessimistic considering Suncor has grown NOPAT by 5% compounded annually over the last five years and 2% compounded annually over the last ten years.
Below, we use our reverse discounted cash flow (DCF) model to quantify the cash flow expectations for different stock price scenarios for SU.
In the first scenario, we quantify the expectations baked into the current price. If we assume:
- NOPAT margin falls to 11% (equal to 5-yr average of and below TTM margin of 15%) from 2025 to 2034, and
- revenue grows at consensus estimates in 2025 (-1%) and 2026 (-0.4%), and
- revenue grows 2% compounded annually (below 5-year CAGR) from 2027 through 2034,
then the stock would be worth $38/share today – or equal to the current stock price. In this scenario, Suncor’s NOPAT would fall 1% through 2034, which is well below historical growth rates. Contact us for the math behind this reverse DCF scenario.
Shares Could Go 30%+ Higher at Minimal Profit Growth
If we instead assume Suncor’s:
- NOPAT margin falls to 13% (below 15% in the TTM) from 2025 to 2034 and
- revenue grows at consensus estimates in 2025 (-1%) and 2026 (-0.4%), and
- revenue grows 3% compounded annually (equal to 5-year CAGR) from 2027 through 2034,
SU would be worth at least $51/share today – a 34% upside to the current price. In this scenario, Suncor’s NOPAT would grow 1% through 2034. Contact us for the math behind this reverse DCF scenario.
Should SU grow profits more in line with historical levels, the stock has even more upside. Figure 8 compares Suncor’s historical NOPAT to the NOPAT implied in each of the above DCF scenarios.
Figure 8: Suncor’s Historical and Implied NOPAT: DCF Valuation Scenarios
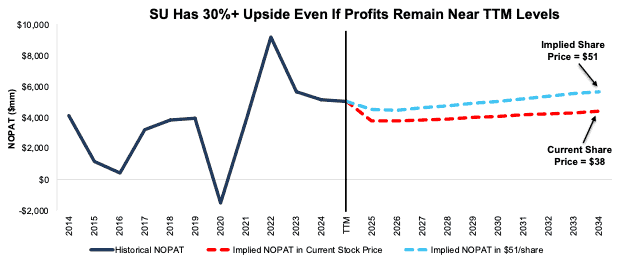
Sources: New Constructs, LLC and company filings.
This article was originally published on June 25, 2025.
Disclosure: David Trainer, Kyle Guske II, and Hakan Salt receive no compensation to write about any specific stock, sector, style, or theme.
Questions on this report or others? Join our online community and connect with us directly.