
By: Guest writer, John Rotonti, Host of The JRo Show
“The hallmarks of increasing returns for a business are rising ROICs and a high market share.” – Michael Mauboussin
“These results are consistent with our analysis that shows that rising ROICs over a three-year period are associated with attractive TSRs and falling ROICs are related to poor TSRs.” – Michael Mauboussin
“The simple answer is that I like to see it [ROIC] calculated both ways [with goodwill and intangibles left in and taken out]…The longer answer is if a company has been acquisitive and I would expect them to remain so, I would lean toward leaving in goodwill. If the company did a huge deal, is saddled with a lot of goodwill, and is not active in M&A, I would lean toward removing it. The basic idea behind excluding it is that you get a better sense of the underlying economics of the business.” – Michael Mauboussin
“I don’t see it as an either/or selection [either ROIC or ROTIC]. If you are assessing how well the company allocated its capital when it made acquisitions, of course you want the denominator to include the full cost of those acquisitions, not just the tangible assets that were acquired. If, however, you are making projections about returns from future investment for organic growth, then you would not want the denominator to include the acquisition premium.” – Bill Nygren
A friend of mine who is new to the New Constructs platform recently emailed me saying that he was surprised CME Group (Nasdaq: CME) was of such low quality with a trailing twelve month (TTM) return on invested capital (ROIC) of only 8%. He was getting this information from the top of the ratings page…
Figure 1: CME Rating Details

Sources: New Constructs, LLC and company filings
I explained to him that CME Group was anything but low quality, and then walked him through where to find additional quality metrics on the New Constructs platform. I thought now would be a good time to share how to more fully assess business quality on the platform.
To be clear this is not a recommendation to Buy CME Group. In fact, I’m not even going to mention what the company does or spend any time discussing growth opportunities, risks, or valuation. I don’t touch on management or capital allocation either (although one of the first things you’ll notice in your own research is that the company pays a big and growing dividend that yields about 5%). The focus of this article is only to explain some basic accounting and financial statement analysis and to show you how to get more from the New Constructs platform when measuring business quality.
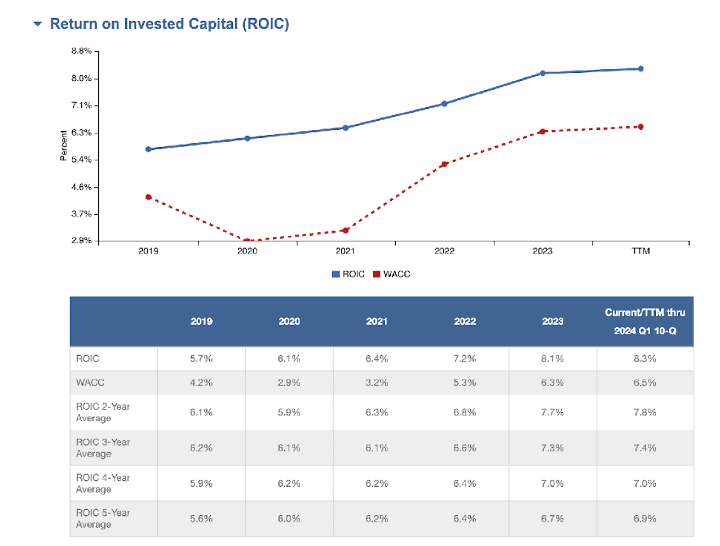
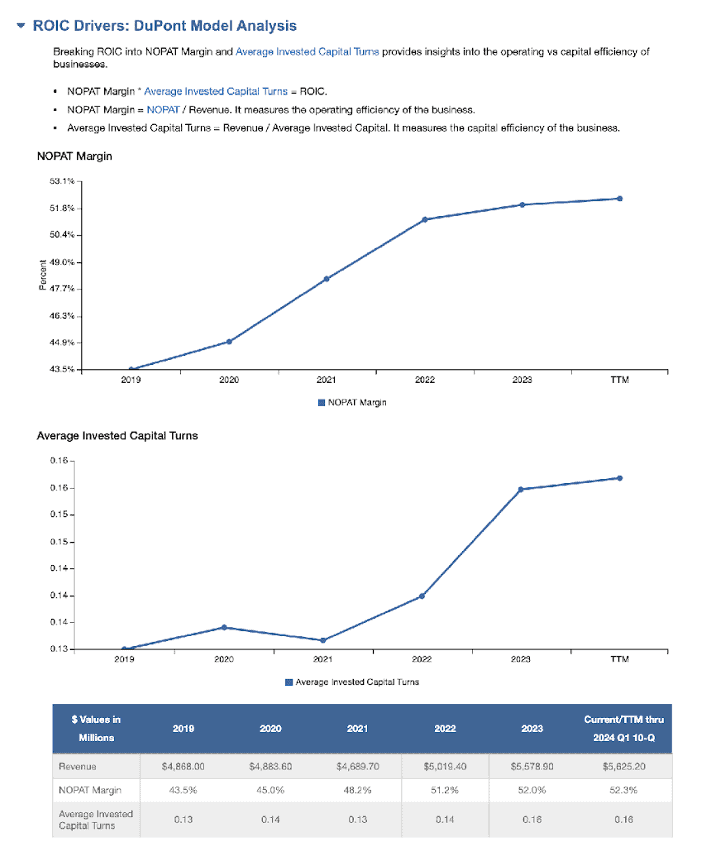
CME is an interesting case study and shows how basic screens can miss obvious business quality and/or improving quality. While it’s true that CME has a low ROIC of 8% (because of large goodwill and intangibles from past acquisitions) notice that its ROIC has increased each of the past 5 years, and a DuPont analysis shows the increase in ROIC is driven by BOTH rising net operating profit after tax (NOPAT) margins (which are incredibly high with 5-year average NOPAT margins of 48%) AND somewhat higher invested capital turnover.
So even though ROIC is low, it is improving (and rising ROIC is a main driver of intrinsic value growth, especially when ROIC is starting from a low base), and that improvement is being driven by BOTH higher NOPAT margins (profitability on the income statement) and higher capital velocity (balance sheet efficiency). So, CME Group seems to really be firing on all cylinders right now despite low market volatility (CME Group’s business should benefit from higher volatility in the future). Please reference the quotes above from Michael Mauboussin showing that improving ROIC is a major driver of stock returns!
Figure 2: CME Dupont Analysis
Sources: New Constructs, LLC and company filings
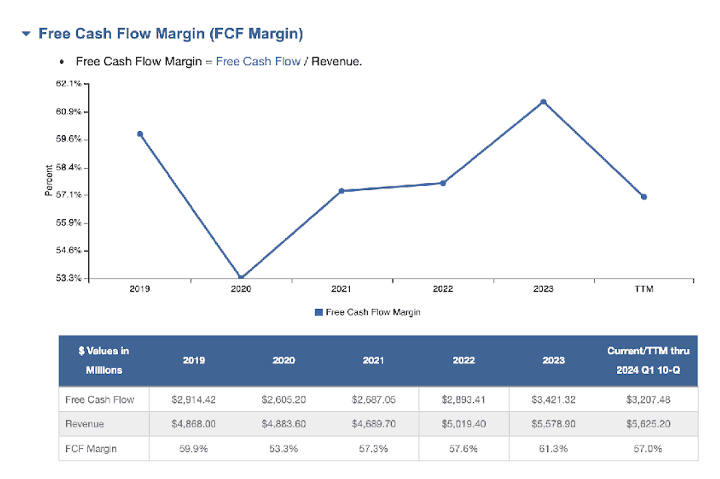
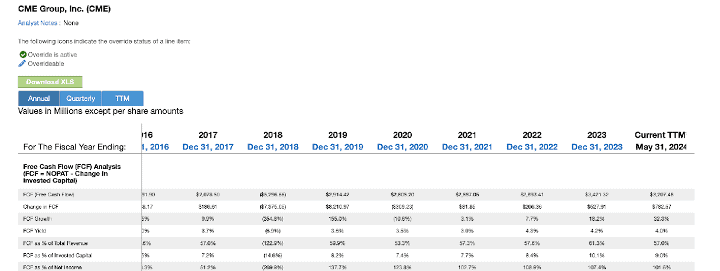
Then when I scrolled down the ratings page a little further, I see that CME Group has 5-year average free cash flow (FCF) margins of 58%, which are some of the highest FCF margins I’ve ever come across. This means that CME Group is turning 58 cents of every dollar of revenue into no-strings-attached free cash flow that can be returned to shareholders through (1) paying down debt, (2) paying a growing dividend, or (3) buying back stock (hopefully at discounted prices).
Just for perspective, Visa (NYSE: V), which is arguably the highest-quality business on earth, has four-year average FCF margins through 2023 of also exactly 58%. I used a four-year average for Visa because 2019 was an outlier for Visa where its FCF margins were abnormally low at 16%. If I had included 2019, then Visa’s 5-year average FCF margin drops to 50% (which is still incredibly high, but less than CME Group). I hope this gives you a sense for just how high-quality and FCF-generative CME Group is!
Figure 3: CME Free Cash Flow Margin Analysis
Sources: New Constructs, LLC and company filings
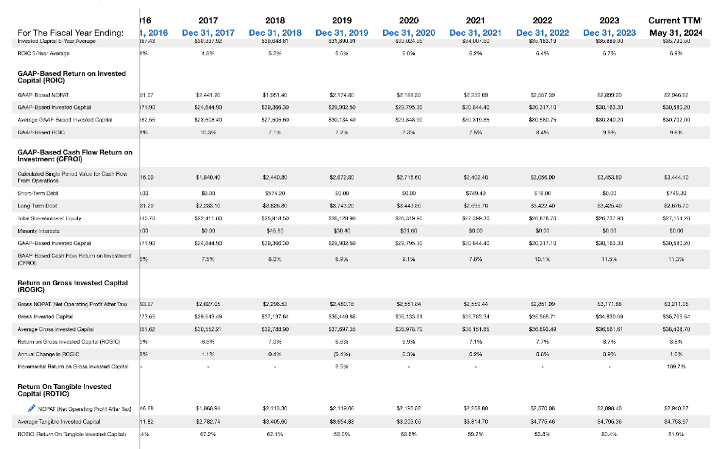
Then, if I leave the ratings page and go into the “company model” tab and click on “metrics” I find that its return on tangible invested capital (ROTIC) has averaged a whopping 60% over the past 5 years and was 62% over the TTM (a delta that is 54 points higher than its ROIC). Why do I think ROTIC is a better metric of the underlying economics of CME Group’s business? Because CME Group hasn’t made an acquisition of size in six years (its last large acquisition was 2018) and the most recent acquisition prior to 2018 came all the way back in 2012 (once again about six years prior).
While in the metrics tab of the model I also see that CME Group’s FCF conversion (or FCF as a percent of GAAP net income) has averaged 116% over the past five years. High FCF conversion above 100% not only shows the company’s FCF generation prowess, but also indicates high earnings quality.
So, despite (optically) low ROIC, CME generated 5-yr average FCF margins of a whopping 58% because of high NOPAT margins (in the 50% range), high returns on capital for the underlying business, and low capex with 5-year average capex/sales of only 3%.
Figure 4: CME ROIC & FCF Analysis from New Constructs’ Company Model
Sources: New Constructs, LLC and company filings
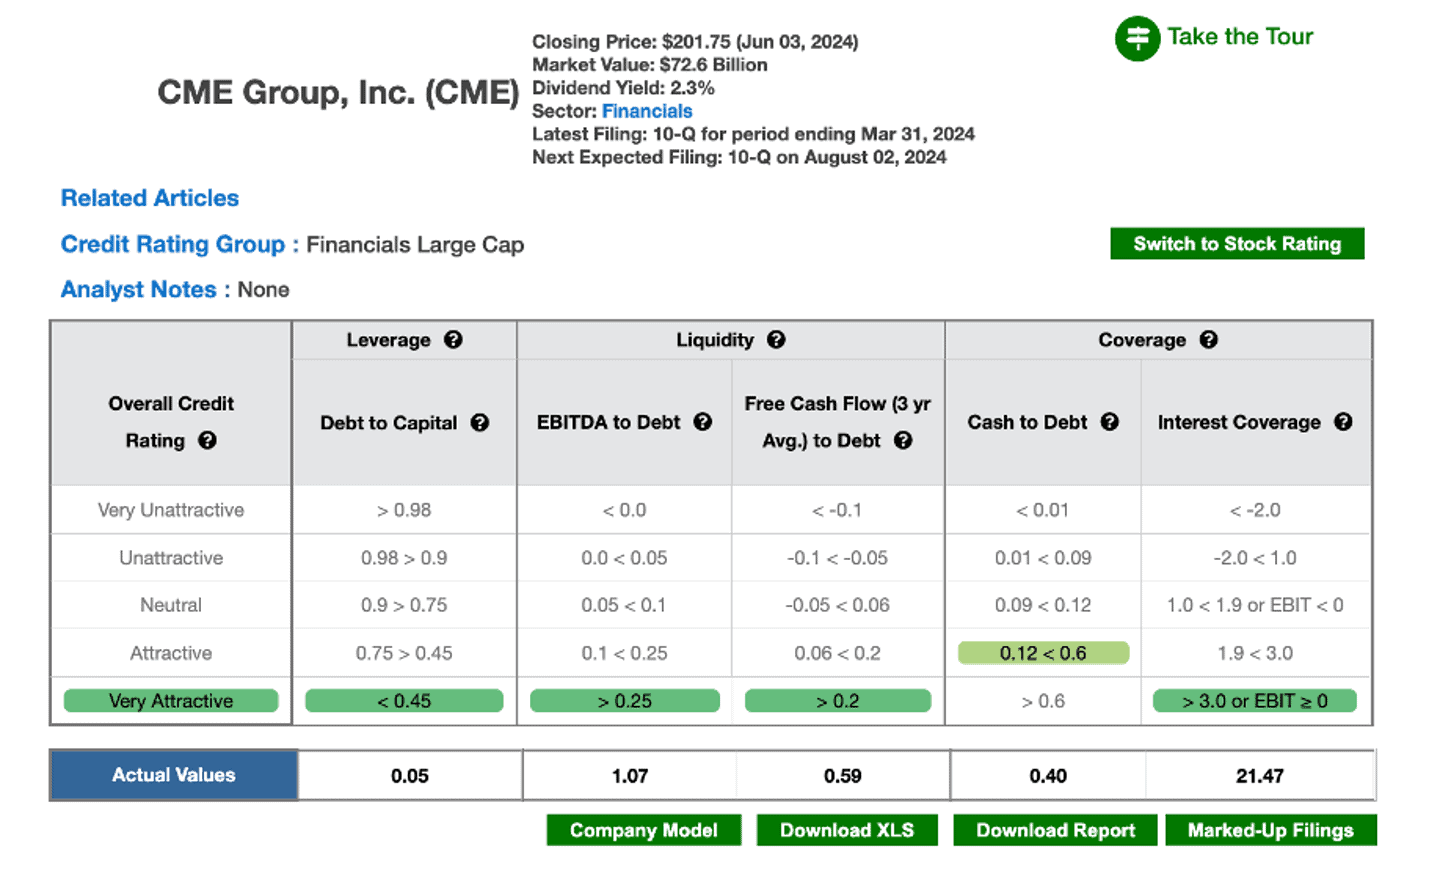
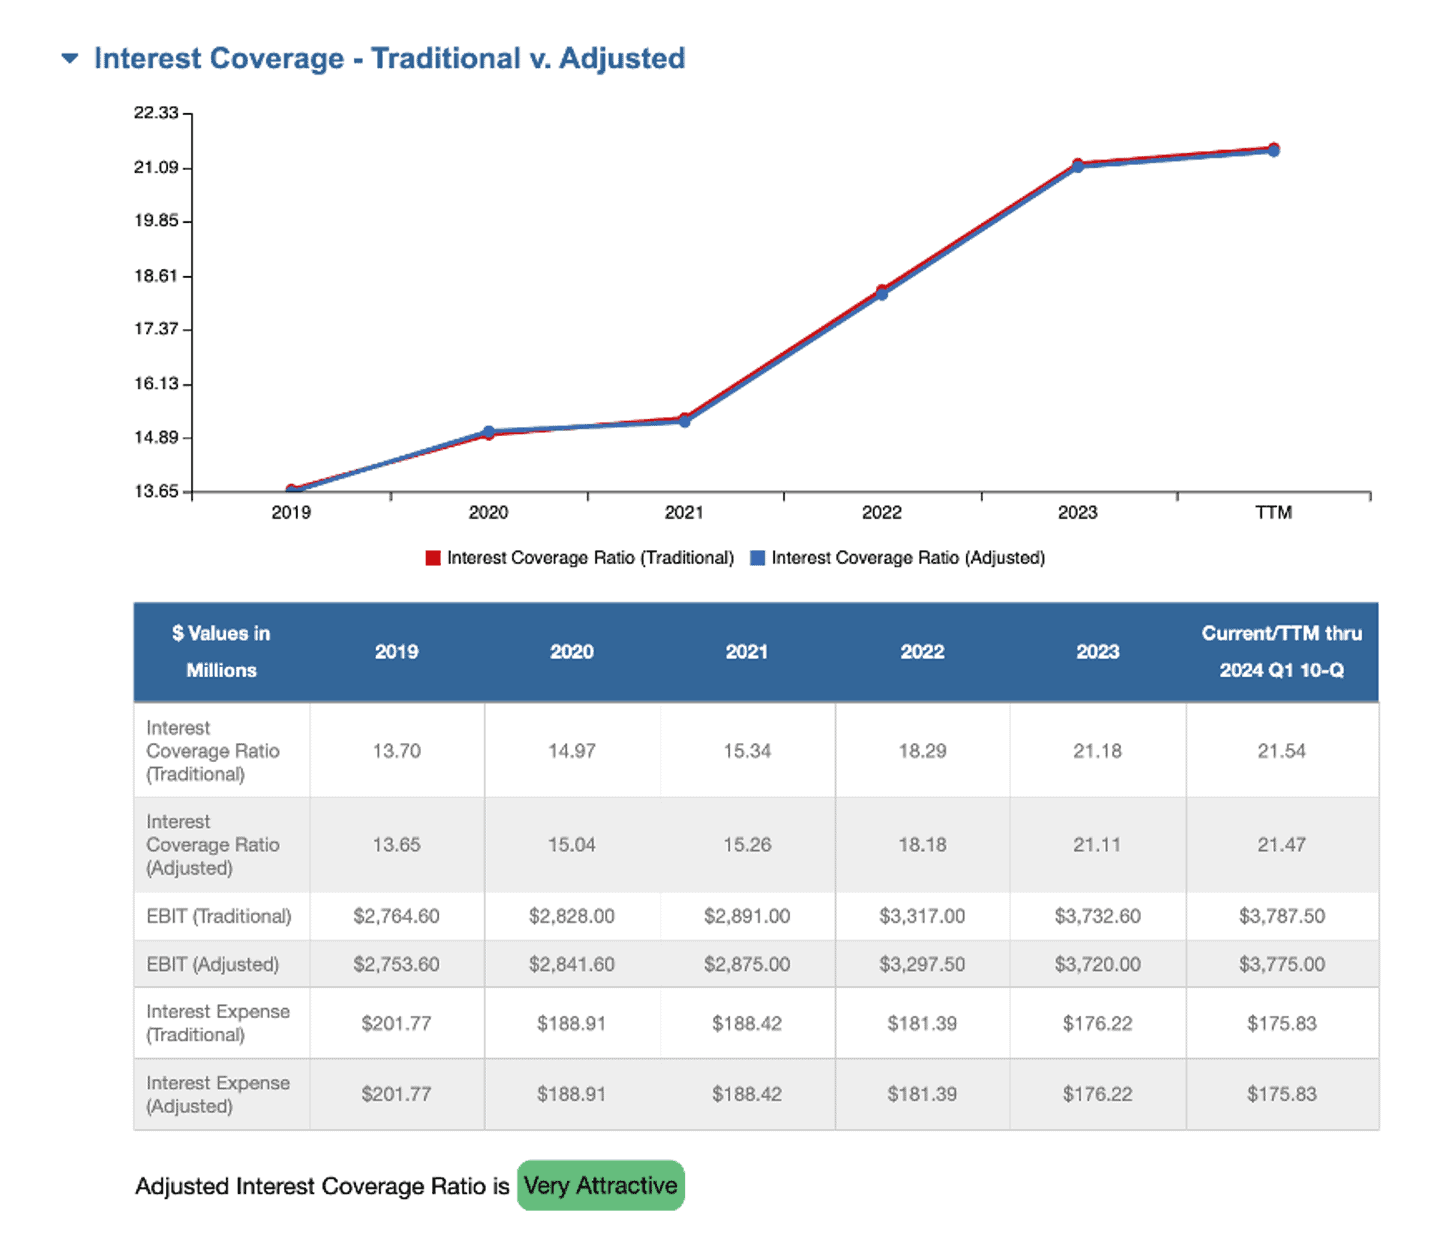
Finally, no analysis of business quality would be complete without analyzing the balance sheet. The balance sheet is the structural foundation of a strong business, and I don’t think a resilient business can be built on top of a weak foundation. New Construct’s platform allows you to check the health of the balance sheet by clicking “switch to credit rating” on the ratings page. As you can see, New Constructs gives CME Group its highest credit rating of “very attractive” because it has an interest coverage ratio (EBIT divided by interest expense) of 21.5x and a three-year average FCF-to-debt of 0.59x. An interest coverage of 21.5 indicates that one year’s worth of operating income (EBIT) could pay almost 22 year’s worth of interest expense, and an average FCF-to-debt of 0.59 means that CME Group could pay off all its debt with less than two year’s worth of FCF. Also note how its interest coverage ratio improved from 14x in 2019, another indication that its fundamentals (quality) are improving over time.
Figure 5: CME Credit Rating Details
Sources: New Constructs, LLC and company filings
To conclude, I have no doubt that CME Group is a very high-quality business. The lesson is not that ROTIC is more important than ROIC. It’s not. The lesson is that you need to be aware of both, especially when there is a large delta between the two. The lesson is that when you see a company on the ratings page with low ROIC but extremely high NOPAT margins and FCF margins, the vast majority of time it’s because of high goodwill and intangibles from past acquisitions, which results in a much higher ROTIC. In the case of a company like CME Group it may pay to look at both ROIC and ROTIC and understand what’s driving the delta, and that a low ROIC (that is at least above the company’s cost of capital) in and of itself does not always indicate low quality. The other lesson is that basic screens for TTM ROIC on a free website tell you very little, if anything at all. As an analyst, the quality of the data matters dearly, and it helps to look at the long-term trend lines and inflection points in ROIC, understand what’s driving the increase or decrease in ROIC, connect the numbers to the narrative, and then determine where you think ROIC will go in the future (and why). New Construct’s model helps with this.
I hope this helps and encourages you all to study the ratings page and then go into the model for additional, powerful data and tools.
By the way, CME Group is not alone. Fiserv (NYSE: FI), Broadcom (Nasdaq: AVGO), and CDW (Nasdaq: CDW) are all high-quality businesses with ROTIC much higher than ROIC. Go into the New Constructs model and check it out!
Disclaimer: John owns shares of CDW, CME Group, and Visa.
This article was originally published on June 20, 2024.
Disclosure: David Trainer, Kyle Guske II, and Hakan Salt, receive no compensation to write about any specific stock, sector, style, or theme.
Questions on this report or others? Join our Society of Intelligent Investors and connect with us directly.