ROIC Drivers - DuPont Model
Metrics are only as good as the data that drive them. The best fundamental data in the world drives our metrics. Here’s proof from some of the most respected public & private institutions in the world.
Breaking return on invested capital (ROIC) into NOPAT Margin and Average Invested Capital Turns provides insights into the operating vs. capital efficiency of businesses, aka DuPont Analysis.
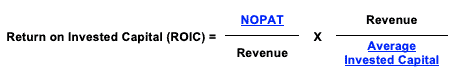
NOPAT/Revenue is the NOPAT Margin, which measures the operating efficiency of businesses. Revenue/Average Invested Capital equals Average Invested Capital Turns, which measure the capital efficiency of businesses.
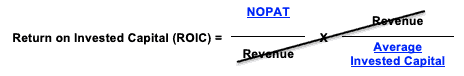
When you multiply the NOPAT Margin by Invested Capital Turns, Revenue cancels out, and we have NOPAT/Average Invested Capital or ROIC.
Clients get access to the ROIC Drivers for every stock in their portfolios with us.
Companies with similar ROICs can have very different business models and only by analyzing NOPAT margin and invested capital turns can we determine where there may be the most opportunity for improvement.
This paper compares our analysis on a mega cap company to other major providers.
Want To Learn More?
Sign up to receive free alerts about all our new research reports including Long Ideas and Danger Zone picks.
See our webinar on importance of ROIC and how to calculate it.
Get our report on "ROIC: The Paradigm For Linking Corporate Performance to Valuation."