
This week’s Filing Season Finds report highlights Merck & Co. (MRK: $95/share) for understating its profits by $1.3 billion (8% of GAAP earnings). It is just one of the discoveries from the many 10-Ks and 10-Qs our Robo-Analyst[1] analyzed in the third week of Filing Season.
Filing Season Finds reports are available only to Pro and Institutional members. More of the insights revealed by our Robo-Analyst technology during Filing Season are available here. Since 2005, we’ve reported how traditional earnings measures are unreliable due to accounting loopholes that allow companies to manage earnings. Our proprietary Core Earnings exclude unusual gains and losses to provide a more reliable earnings measure and a new source of alpha.
The Power of the Robo-Analyst
From the many 10-K and 10-Q filings analyzed by our Robo-Analyst in the third week of Filing Season (February 23 through March 1), we collected 102,097 data points. This data led to 15,399 Core Earnings, balance sheet, and valuation adjustments with a combined dollar value of $7.5 trillion. The adjustments were applied as follows:
- 6,274 income statement adjustments with a total value of $519.4 billion
- 5,977 balance sheet adjustments with a total value of $3.0 trillion
- 3,148 valuation adjustments with a total value of $4.0 trillion
Figure 1: Filing Season Diligence for 2024 10-K Filing Season: Feb-Mar 2025

Sources: New Constructs, LLC and company filings.
Every year from mid-February through early March, we parse and analyze over 2,000 10-Ks and 10-Qs to update our models for companies with 12/31 and 1/31 fiscal year ends. This combination of technology and human expertise enables investors to overcome the flaws in legacy fundamental research and make more informed investment decisions.
Proprietary Footnotes Data Drives Alpha
While we’re explaining the diligence required to calculate Core Earnings and generate proven-superior Stock Ratings, we want to show you how both deliver alpha. We’ve developed multiple indices for tracking the performance of portfolio strategies based on Core Earnings and our Stock Ratings. All are outperforming the S&P 500 this year. See Figures 2 and 3.
Figure 2 compares the performance of the Bloomberg New Constructs 500 Index (ticker: B500NCT:IND), managed by Bloomberg, to the S&P 500. This index takes the top 500 stocks by market cap and tilts toward the companies with high Earnings Capture, based on our proprietary Core Earnings data. From January 1 to March 11, 2025, the Bloomberg New Constructs 500 Total Return Index (ticker: BNCVAT1T:IND) is down 3.4% while the S&P 500 is down 5.0%.
Figure 2: Bloomberg New Constructs 500 Index Strongly Outperforms the S&P 500 Year to Date
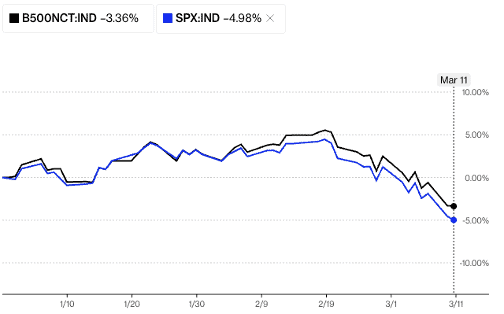
Sources: Bloomberg
Note: Past performance is no guarantee of future results.
Figure 3 compares the performance of the Bloomberg New Constructs Ratings VA-1 Index (ticker: BNCVA1T:IND), managed by Bloomberg, to the S&P 500. This index tracks the stocks in the Bloomberg 1000 Index that earn our Very Attractive Rating. From January 1 to March 11, 2025, the Bloomberg New Constructs Ratings VA-1Index (ticker: BNCVAT1T:IND) is up 2.6% while the S&P 500 is down 5.0%.
Figure 3: Very Attractive-Rated Stocks Strongly Outperform the S&P 500 Year to Date
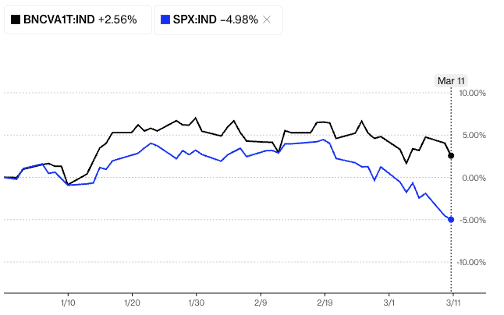
Sources: Bloomberg
Note: Past performance is no guarantee of future results.
This article was originally published on March 11, 2025.
Disclosure: David Trainer, Garrett O’Grady, Kyle Guske II, and Hakan Salt receive no compensation to write about any specific stock, sector, style, or theme.
Questions on this report or others? Join our online community and connect with us directly.
[1] Harvard Business School features the powerful impact of our research automation technology in New Constructs: Disrupting Fundamental Analysis with Robo-Analysts.