Picking from the multitude of style ETFs is a daunting task. There are as many as 45 in any given style and at least 230 ETFs across all styles.
Why are there so many ETFs? The answer is: because ETF providers are making lots of money selling them. The number of ETFs has little to do with serving investors’ best interests. Below are three red flags investors can use to avoid the worst ETFs:
- Inadequate liquidity
- High fees
- Poor quality holdings
I address these red flags in order of difficulty to overcome. Advice on How to Find the Best Style ETFs is here.
How To Avoid ETFs with Inadequate Liquidity
This is the easiest issue to avoid and my advice is simple: Avoid all ETFs with less than $100 million in assets. Low levels of liquidity can lead to a discrepancy between the price of the ETF and the underlying value of the securities it holds. In addition, low asset levels tend to mean lower volume in the ETF and large bid-ask spreads.
How To Avoid High Fees
ETFs should be cheap, but not all of them are. The first step here is to measure what is cheap and expensive.
To ensure you are paying at or below average fees, invest only in ETFs with an expense ratio below 0.44%, which is the average total annual cost (TAC) of the 230 U.S. equity style ETFs I cover. Weighting the TAC by assets under management, the average expense ratio is lower at 0.19%. The lower weighted-average TAC is a good sign that investors are putting money in the cheaper ETFs.
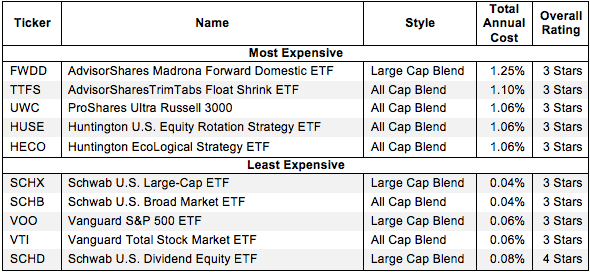
Figure 1 shows the most and least expensive style ETFs in the US equity universe based on total annual costs. Advice on How to Avoid the Worst Sector ETFs is here.
Figure 1: Most and Least Expensive ETFs
 Sources: New Constructs, LLC and company filings
AdvisorShares Madrona Forward Domestic ETF (FWDD) and AdvisorShares TrimTabs Float Shrink ETF (TTFS) are the two most expensive U.S. equity style ETFs I cover. Schwab U.S. Large-Cap ETF (SCHX) and Schwab U.S. Broad Market ETF (SCHB) are the two least expensive. In addition to being one of the five least expensive, Schwab U.S. Dividend Equity ETF (SCHD) has over $1.3 billion in assets and is my fourth-best ranked style ETF overall.
Interestingly, AdvisorShares TrimTabs Float Shrink ETF (TTFS), is the next highest rated ETF in Figure 1, ranking 17th among all the style ETFs I cover overall despite being among the five most expensive. TTFS holds one of the strongest portfolios among the ETFs that I cover.
These observations underscore why investors should not choose ETFs based only on price. The quality of holdings matters more than price in making an ETF attractive for investors.
How To Avoid ETFs with the Worst Holdings
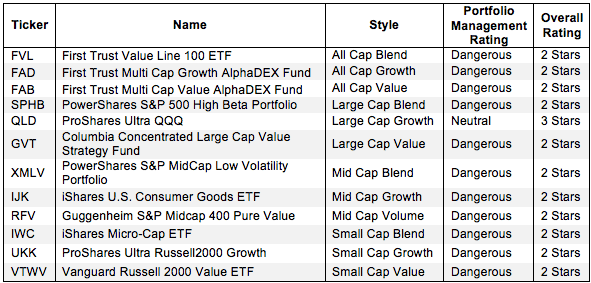
This step is by far the hardest, but it is also the most important because an ETF’s performance is determined more by its holdings than its costs. Figure 2 shows the ETFs within each style with the worst holdings or portfolio management ratings. The ETFs are listed in descending order by style per my style ratings, detailed in my 4Q Style Rankings report.
Figure 2: Style ETFs With the Worst Holdings
 Sources: New Constructs, LLC and company filings
My overall ratings on ETFs are based primarily on my stock ratings of their holdings. My firm covers over 3000 stocks and is known for the due diligence done on each stock we cover.
First Trust, ProShares, PowerShares and iShares ETFs appear more often than any other provider in Figure 2, which means they offer the most ETFs with the worst holdings. The worst-rated ETFs in the All Cap Blend, All Cap Growth and All Cap Value categories all belong to First Trust: First Trust Value Line 100 ETF (FVL), First Trust Multi Cap Growth AlphaDEX Fund (FAD), First Trust Multi Cap Value and AlphaDEX Fund (FAB).
The Danger Within
Buying an ETF without analyzing its holdings is like buying a stock without analyzing its business and finances. As Barron’s says, investors should know the Danger Within. Put another way, research on ETF holdings is necessary due diligence because an ETF’s performance is only as good as its holdings’ performance.
PERFORMANCE OF ETF’s HOLDINGs = PERFORMANCE OF ETF
Note that no ETFs with a dangerous portfolio management rating earn an overall rating better than two stars. These scores are consistent with my belief that the quality of an ETF is more about its holdings than its costs. If the ETF’s holdings are dangerous, then the overall rating cannot be better than dangerous because one cannot expect the performance of the ETF to be any better than the performance of its holdings – no matter how cheap it may be.
Find the ETFs with the worst overall ratings on my ETF screener. More analysis of the Best Style ETFs is here.
Best & Worst Stocks In these ETFs
Southwest Airlines (LUV) is one of my least favorite stocks in FWDD’s top five holdings and earns my Very Dangerous rating. Southwest Airlines has grown after-tax profits (NOPAT) by only 1% compounded annually over the last 14 years and the last time the company realized positive economic earnings was in 1999. Southwest generates a return on invested capital (ROIC) of 4%, which puts it in the bottom quintile of stocks that I cover. Worse yet, LUV has high growth expectations embedded in its stock price. To justify LUV’s current price of ~$17/share, the company would have to grow NOPAT by 11% compounded annually over the next 19 years. Having only grown profits by 1% compounded annually over the last 14 years, these expectations seem very high. Investors should avoid LUV.
The Coca-Cola Company (KO) is one of my favorite holdings in SCHD, the only low-cost ETF in Figure 1 to get my 4-star rating. The Coca-Cola Company has grown its after-tax profits (NOPAT) by 9% compounded annually over the last 14 years and has maintained a return on invested capital (ROIC) of at least 14% over the same timeframe. It is rare to see companies sustain NOPAT growth and ROIC like The Coca-Cola Company has. Even with such consistency, KO is cheaply valued. KO currently trades at ~$40, which gives it a price-to-economic book value ratio of 1.2. This valuation implies that the market expects The Coca-Cola Company to grow NOPAT by only 20% for the remainder of its existence. Given that the company has grown NOPAT by 9% compounded annually for more than a decade, these expectations seem too low. Strong, steady growth and low expectations make KO a great value for investors.
Jared Melnyk contributed to this report.
Disclosure: David Trainer and Jared Melnyk receive no compensation to write about any specific stock, sector, or theme.