Finding the best ETFs is an increasingly difficult task in a world with so many to choose from. How can you pick with so many choices available?
Don’t Trust ETF Labels
There are at least 150 different All Cap Blend ETFs and at least 514 ETFs across twelve styles. Do investors need 42+ choices on average per style? How different can the ETFs be?
Those 150 All Cap Blend ETFs are very different. With anywhere from 24 to 3678 holdings, many of these All Cap Blend ETFs have drastically different portfolios, creating drastically different investment implications.
The same is true for the ETFs in any other style, as each offers a very different mix of good and bad stocks. All Cap Value ranks first for stock selection. Small Cap Growth ranks last. Details on the Best & Worst ETFs in each style are here.
How to Avoid Paralysis by Analysis
We think the large number of All Cap Blend (or any other) style ETFs hurts investors more than it helps because too many options can be paralyzing. It is simply not possible for the majority of investors to properly assess the quality of so many ETFs. Analyzing ETFs, done with the proper diligence[1], is far more difficult than analyzing stocks because it means analyzing all the stocks within each ETF. As stated above, that can be as many as 3678 stocks, and sometimes even more, for one ETF.
Anyone focused on fulfilling the fiduciary duty of care recognizes that analyzing the holdings[2] of an ETF is critical to finding the best ETF. Only our research utilizes the superior data and earnings adjustments featured by the Harvard Business School and MIT Sloan paper, "Core Earnings: New Data and Evidence.” Figure 1 shows our top-rated ETF for each style.
Figure 1: The Best ETF in Each Style
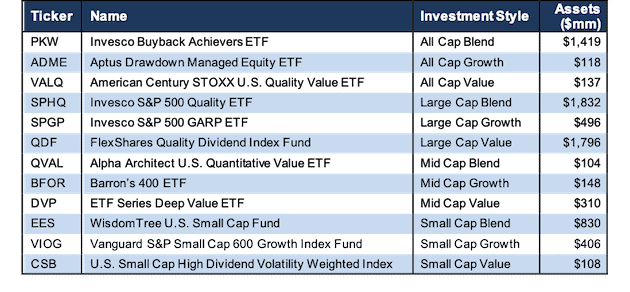
* Best ETFs exclude ETFs with TNAs less than $100 million for inadequate liquidity
Sources: New Constructs, LLC and company filings
Amongst the ETFs in Figure 1, Alpha Architect U.S. Quantitative Value ETF (QVAL) ranks first overall, American Century STOXX U.S. Quality Value ETF (VALQ) ranks second, and FlexShares Quality Dividend Index Fund (QDF) ranks third. Vanguard S&P Small-Cap 600 Growth Index Fund (VIOG) ranks last.
How to Avoid “The Danger Within”
Why do you need to know the holdings of ETFs before you buy?
You need to be sure you do not buy an ETF that might blow up. Buying an ETF without analyzing its holdings is like buying a stock without analyzing its business and finances. No matter how cheap, if it holds bad stocks, the ETF’s performance will be bad. Don’t just take my word for it, see what Barron’s says on this matter.
PERFORMANCE OF FUND’S HOLDINGS = PERFORMANCE OF FUND
Analyzing each holding within funds is no small task. Our Robo-Analyst technology enables us to perform this diligence with scale and provide the research needed to fulfill the fiduciary duty of care. More of the biggest names in the financial industry (see At BlackRock, Machines Are Rising Over Managers to Pick Stocks) are now embracing technology to leverage machines in the investment research process. Technology may be the only solution to the dual mandate for research: cut costs and fulfill the fiduciary duty of care. Investors, clients, advisors and analysts deserve the latest in technology to get the diligence required to make prudent investment decisions.
If Only Investors Could Find Funds Rated by Their Holdings
Our ETF ratings leverage our stock coverage. We rate ETFs based on the aggregated ratings of the stocks each ETF holds.
Alpha Architect U.S. Quantitative Value ETF (QVAL) is not only the top-rated Mid Cap Blend ETF, but is also the overall top-ranked style ETF that meets our liquidity minimums out of the 514 style ETFs that we cover.
The worst ETF in Figure 1 is Vanguard S&P Small-Cap 600 Growth Index Fund (VIOG), which gets a Neutral rating. One would think ETF providers could do better for this style.
This article originally published on January 30, 2020.
Disclosure: David Trainer, Kyle Guske II, and Matt Shuler receive no compensation to write about any specific stock, style, or theme.
Follow us on Twitter, Facebook, LinkedIn, and StockTwits for real-time alerts on all our research.
[1] This paper compares our analytics on a mega cap company to Bloomberg and Capital IQ (SPGI) in a detailed appendix.
[2] Harvard Business School features the powerful impact of our research automation technology in the case New Constructs: Disrupting Fundamental Analysis with Robo-Analysts.