
As a short-term predictor of the likelihood of a company to miss expectations in the next quarter, our Earnings Distortion Score compliments, but does not override, our longer-term Risk/Reward ratings.
We measure Earnings Distortion (as featured on CNBC Squawk Box) using a proprietary human-assisted ML technology featured in a recent paper from Harvard Business School (HBS) and MIT Sloan. This paper empirically shows that CompuStat and street earnings estimates are incomplete and less accurate since they do not consistently and accurately adjust for unusual gains/losses buried in footnotes.
We leverage our proprietary dataset of unusual gains/losses to derive Earnings Distortion Scores for ~3,000 stocks. These scores indicate how likely companies are to beat or miss estimates based on how much unusual gains/losses cause unadjusted earnings measures to be over/understated.
The Earnings Distortion Score formula is: Core Earnings Distortion divided by Total Assets
We decile these values and, then, categorize into a 5-tier scoring system:
- Strong Beat – Top decile (Least earnings distortion)
- Beat – Second and third Decile
- In line – Fourth, fifth, sixth and seventh decile
- Miss – Eighth and ninth decile
- Strong Miss – Bottom decile (Most earnings distortion)
We scale core earnings distortion by total assets so large companies don’t dominate the rankings, as they are likely to have more earnings distortion simply due to their size. Further, this approach mirrors the strategy in “Core Earnings: New Data and Evidence”, which presents a long/short strategy that delivers abnormal returns of 7-10% annually based on our proprietary Earnings Distortion data.
Our Earnings Distortion Scores empower investors to combat management manipulation of earnings. For more on how to use our Earnings Distortion Scores, click here.
Get Earnings Distortion Scores for All ~3000 Stocks Under Coverage
All members get our Earnings Distortion Scores for the stocks in their portfolios. Per Figure 1, you’ll see the Earnings Distortion Score at the far right of your Portfolios.
Figure 1: Earnings Distortion Scores on the Portfolios Page
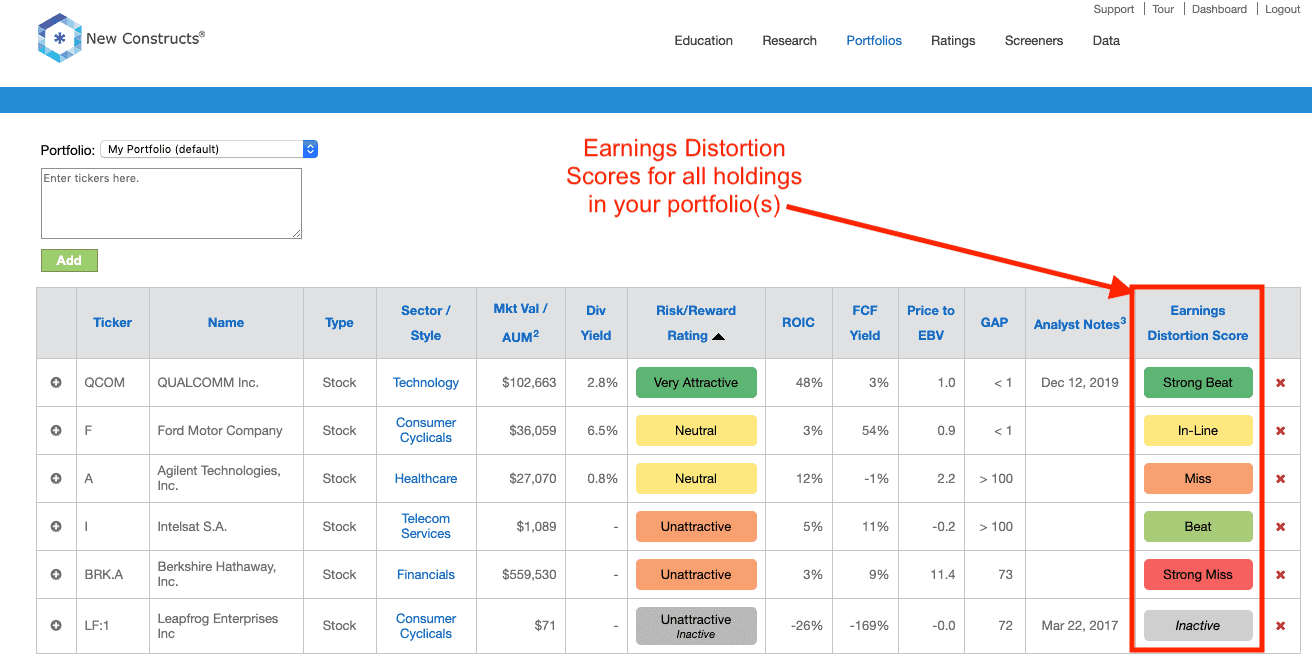
Sources: New Constructs, LLC and company filings
Platinum and higher members also get our Earnings Distortion Scores on the Ratings page. Per Figure 2, the Earnings Distortion Score will display above Analyst Notes on the Ratings page.
Figure 2: Earnings Distortion Scores on the Ratings Page
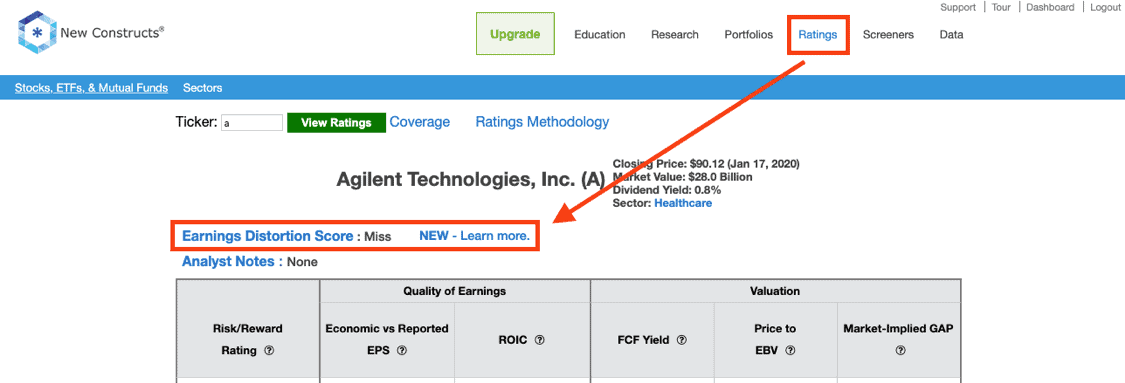
Sources: New Constructs, LLC and company filings
This article originally published on January 13, 2020.
Disclosure: David Trainer, Kyle Guske II, and Sam McBride receive no compensation to write about any specific stock, style, or theme.
Follow us on Twitter, Facebook, LinkedIn, and StockTwits for real-time alerts on all our research.