For those looking for the best financial analysis ratios in the business, you’ve come to the right place.
Harvard Business School (HBS) and MIT Sloan show that our first-ever database of footnotes disclosures provides superior data for measuring “core earnings”. See the Appendix of this paper for direct comparison of our analysis of Invested Capital on a mega cap company to other major research providers.
We give you the financial due diligence needed to fulfill the Fiduciary Duty of Care.
Invested capital equals the sum of all cash that has been invested in a company over its life with no regard to financing form or accounting name. It’s the total investment in the business from which operating profit is derived.
As the denominator in our return on invested capital (ROIC) calculation, invested capital is a very important value, and we place a great deal of importance on getting it right.
We calculate invested capital in two mathematically equivalent ways: financing and operating approach. Figure 1 provides the simplified formula for calculating invested capital.
Figure 1: How To Calculate Average Invested Capital - Simplified

* Non-Interest-Bearing Current Liabilities
** Includes leased assets
Sources: New Constructs, LLC and company filings
When we calculate invested capital, we make numerous adjustments to close accounting loopholes and ensure apples-to-apples comparability across thousands of companies. A company shouldn’t be able to hide from its history, for instance, through write-downs or impairments.
Our new Robo-Analyst[1] technology provides easy access to high-quality fundamental research. There’s no reason for investors not to take advantage of best-in-class calculations of a firm’s invested capital. Figure 2 shows the level of rigor that goes into our invested capital calculation for all companies. We use our Dentsply Sirona (XRAY) model as an example.
Note all clients who subscribe to our valuation models get access to detailed analysis like that in Figure 2. Our models also offer access to all our data in excel and audit-ability of all data back to the original 10-Ks and 10-Qs upon which our models are built.
Figure 2: How to Calculate Invested Capital – Detailed
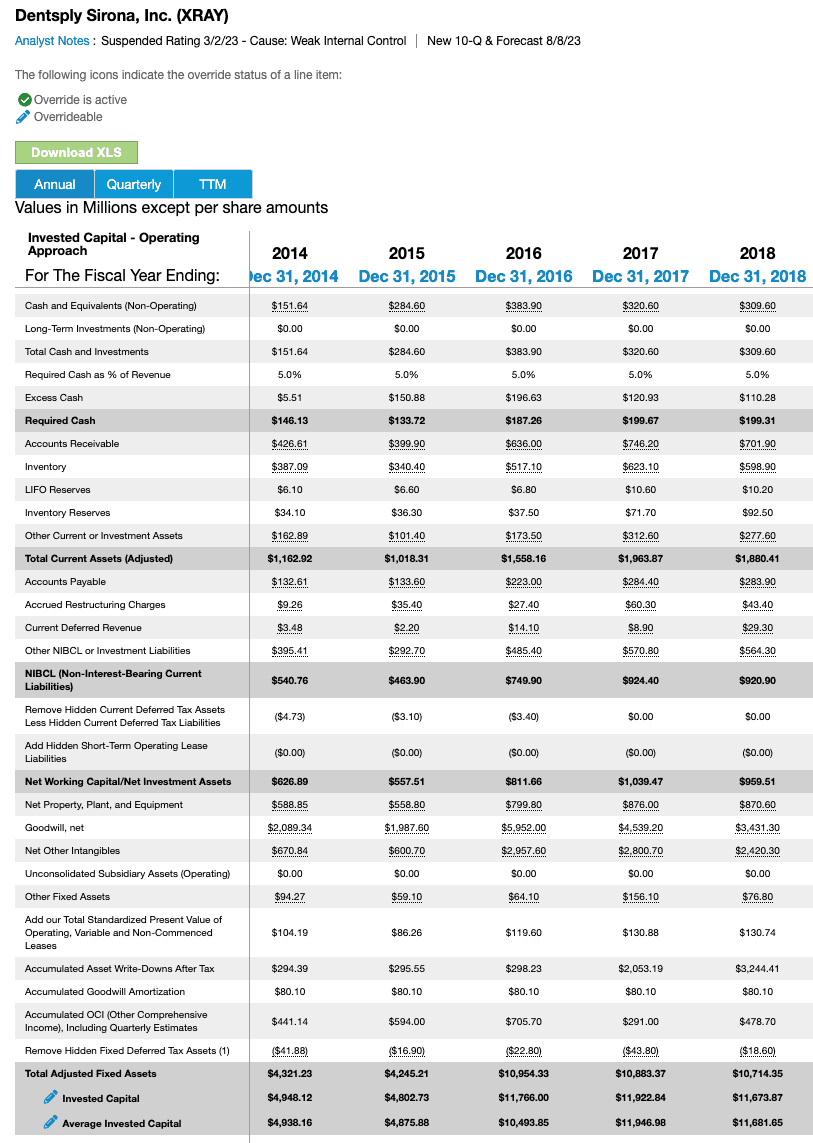
Sources: New Constructs, LLC and company filings
Breaking out each adjustment also allows us to reconcile reported total assets with invested capital. See Figure 3 for the reconciliation for XRAY.
Figure 3: Adjustments to Reconcile Total Assets to Invested Capital: XRAY
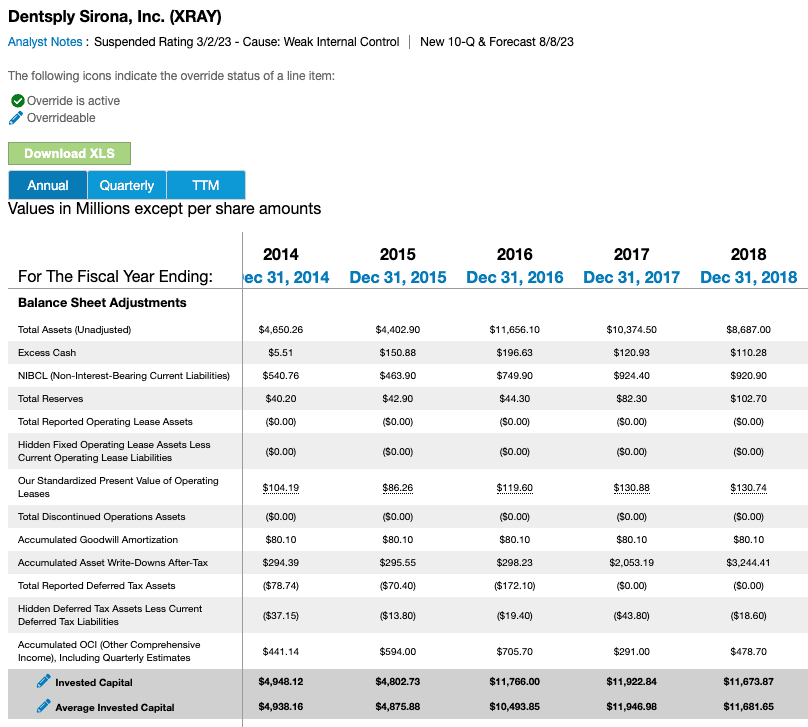
Sources: New Constructs, LLC and company filings
Figure 4 shows the companies with the most under/overstated reported total assets as compared to invested capital in fiscal 2018.
Figure 4: Companies with Most Understated/Overstated Assets in Fiscal 2018
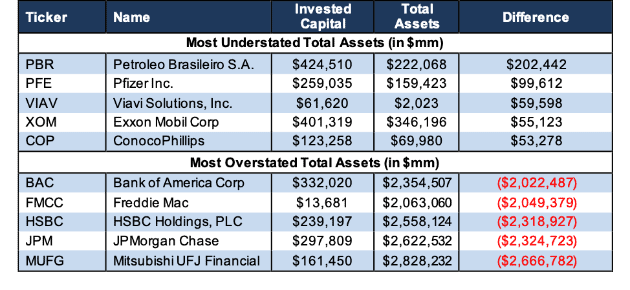
Sources: New Constructs, LLC and company filings.
Petroleo Brasileiro’s (PBR) invested capital is significantly higher than its reported total assets. Our invested capital calculation for PBR can be seen here. The $202 billion discrepancy stems from nearly $70 billion in operating leases, which we include in invested capital, $76 billion in accumulated asset write-downs, and $95 billion in accumulated other comprehensive loss.
Pfizer (PFE), Viavi Solutions (VIAV), Exxon Mobil (XOM), and ConocoPhillips (COP) are the other companies with the most understated reported total asset value. We believe transparency always helps investors, which is why all our calculations are visible throughout each company model. See the adjustments made to XOM’s total assets here and our invested capital calculation here.
On the other hand, Mitsubishi UFJ Financial Group’s (MUFG) invested capital is significantly lower than its reported total assets. See our invested capital calculation for MUFG here. The discrepancy between total assets and invested capital in fiscal 2018 stems from MUFG’s $2.7 trillion in non-interest bearing current liabilities. Per Figure 1 above, we remove NIBCL’s from our calculation of invested capital. Our calculation of MUFG’s 2018 invested capital also takes into account $15 billion in operating leases and nearly $19 billion in accumulated asset write-downs.
JPMorgan Chase (JPM), HSBC Holdings (HSBC), Freddie Mac (FMCC), and Bank of America Corp (BAC) also have some of the most overstated reported total assets in fiscal 2018.
We focus on the economics of business, and, in the process, our models transcend the accounting loopholes and idiosyncrasies that make building good models difficult. Our models and calculations are 100% transparent because we want our clients to know how much work we do to ensure we give them the best earnings quality and valuation models in the business.
This article updated on November 21, 2019.
Disclosure: David Trainer and Kyle Guske II receive no compensation to write about any specific stock, sector, style, or theme.
Follow us on Twitter, Facebook, LinkedIn, and StockTwits for real-time alerts on all our research.
[1] HBS features our technology, the only technology that brings material footnotes data to investors, in the case study: “New Constructs: Disrupting Fundamental Analysis with Robo-Analysts.”
2 replies to "Invested Capital: Explanation & Examples"
Would love an example for financing method. Namely, the common equity and equity equivalents, are you referencing book value of equity?
Hi Daniel,
Thanks for your comment.
Below is a screenshot from our model showing how we calculate Invested Capital from a Financing approach for XRAY. You can compare the image below to the example in the report, which shows how we calculate XRAY’s Invested Capital from an Operating approach.
Additionally, here’s a list of equity equivalents:
1. Deferred tax reserve – usually included in other L-T liabilities
2. Deferred compensation
3. LIFO reserves
4. Accumulated Goodwill Amortization
5. Unrecorded Goodwill
6. Asset Write-offs – Successful efforts vs. Full-cost
7. Other reserves in excess of economic need
8. Excess Cash
Details and definitions on these and more are here in the Balance Sheet Section.