
The Mid Cap Blend style ranks eighth out of the twelve fund styles as detailed in my Style Rankings for ETFs and Mutual Funds report. It gets my Dangerous rating, which is based on aggregation of ratings of 16 ETFs and 327 mutual funds in the Mid Cap Blend style as of April 17, 2014. Prior reports on the best & worst ETFs and mutual funds in every sector and style are here.
Figures 1 and 2 show the five best and worst-rated ETFs and mutual funds in the style. Not all Mid Cap Blend style ETFs and mutual funds are created the same. The number of holdings varies widely (from 23 to 3154), which creates drastically different investment implications and ratings. The best ETFs and mutual funds allocate more value to Attractive-or-better-rated stocks than the worst, which allocate too much value to Neutral-or-worse-rated stocks.
To identify the best and avoid the worst ETFs and mutual funds within the Mid Cap Blend style, investors need a predictive rating based on (1) stocks ratings of the holdings and (2) the all-in expenses of each ETF and mutual fund. Investors need not rely on backward-looking ratings. My fund rating methodology is detailed here.
Investors should not buy any Mid Cap Blend ETFs or mutual funds because none get an Attractive-or-better rating. If you must have exposure to this sector, you should buy a basket of Attractive-or-better rated stocks and avoid paying undeserved fund fees. Active management has a long history of not paying off.
Get my ratings on all ETFs and mutual funds in this style by searching for Mid Cap Blend on my mutual fund and ETF screener. For more products, click here.
Figure 1: ETFs with the Best & Worst Ratings – Top 5
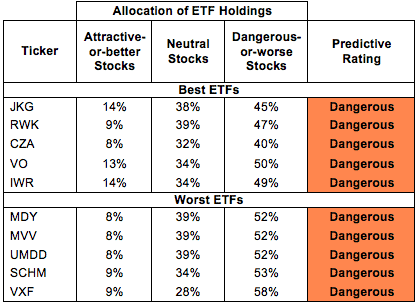 * Best ETFs exclude ETFs with TNAs less than $100 million for inadequate liquidity.
Sources: New Constructs, LLC and company filings
PowerShares RAFI Fundamental Pure Mid Core Portfolio (PXMC) is excluded from Figure 1 because its total net assets (TNA) are below $100 million and do not meet our liquidity standards.
Figure 2: Mutual Funds with the Best & Worst Ratings – Top 5
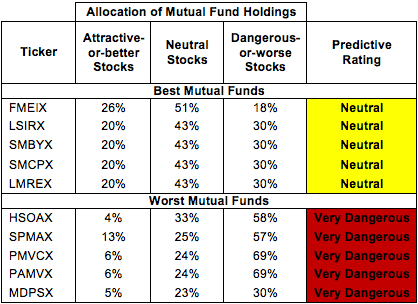 * Best mutual funds exclude funds with TNAs less than $100 million for inadequate liquidity.
Sources: New Constructs, LLC and company filings
iShares Morningstar Mid-Cap ETF (JKG) is my top-rated Mid Cap Blend ETF and Fidelity Commonwealth Trust II: Fidelity Mid Cap Enhanced Index Fund (FMEIX) is my top-rated Mid Cap Blend mutual fund. JKG earns my Dangerous rating and FMEIX earns my Neutral rating.
Vanguard Extended Market ETF (VXF) is my worst-rated Mid Cap Blend ETF and ProFunds: Mid-Cap ProFund (MDPSX) is my worst-rated Mid Cap Blend mutual fund. VXF earns my Dangerous rating and MDPSX earns my Very Dangerous rating.
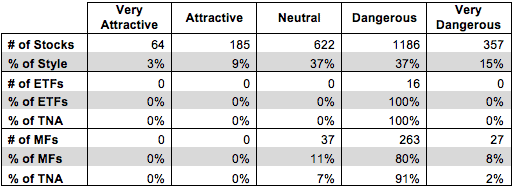
Figure 3 shows that 249 out of the 2414 stocks (over 11% of the market value) in Mid Cap Blend ETFs and mutual funds get an Attractive-or-better rating. However, 0 out of 16 Mid Cap Blend and 0 out of 327 Mid Cap Blend mutual funds get an Attractive-or-better rating.
The takeaways are: mutual fund managers allocate too much capital to low-quality stocks and Mid Cap Blend ETFs hold poor quality stocks.
Figure 3: Mid Cap Blend Style Landscape For ETFs, Mutual Funds & Stocks
 Sources: New Constructs, LLC and company filings
As detailed in “Low-Cost Funds Dupe Investors”, the fund industry offers many cheap funds but very few funds with high-quality stocks, or with what I call good portfolio management.
Investors need to tread carefully when considering Mid Cap Blend ETFs and mutual funds, as no ETFs or mutual funds in the Mid Cap Blend style allocate enough value to Attractive-or-better-rated stocks to earn an Attractive rating. Investors seeking exposure to this style should look to individual stocks.
Amdocs Ltd. (DOX) is one of my favorite stocks held by LSIRX and earns my Very Attractive rating. Over the past decade DOX has grown after-tax profit (NOPAT) by 11% compounded annually. The company currently earns a return on invested capital (ROIC) of 12% and has generated positive economic earnings every year for the past decade. As I wrote in February 2014, the market still hasn’t realized the true value of DOX. At its current price of ~$47/share, DOX has a price to economic book value (PEBV) ratio of just 1.0. This ratio implies that the market expects the company to never grow NOPAT by any meaningful amount for the remainder of its corporate life. DOX has proven their ability to grow over the past 10 years and should easily surpass these low market expectations.
CONSOL Energy, Inc. (CNX) is one of my least favorite stocks held by Mid Cap Blend ETFs and mutual funds and earns my Very Dangerous rating. Over the past seven years, CNX’s NOPAT has declined by 3% compounded annually. The company currently earns a bottom quintile ROIC of 3% and hasn’t generated positive economic earnings in any of the past 16 years. Despite its poor fundamentals, CNX is priced for significant profit growth. To justify its current valuation of ~$41/share, CNX would need to grow NOPAT by 11% compounded annually for the next 23 years. Double-digit growth for two decades seems highly unlikely after nearly a decade of NOPAT decline.
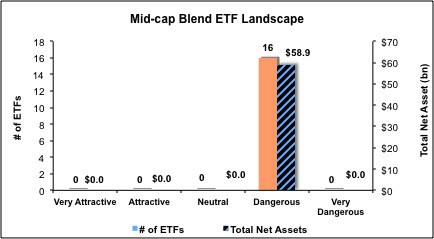
Figures 4 and 5 show the rating landscape of all Mid Cap Blend ETFs and mutual funds.
My Style Rankings for ETFs and Mutual Funds report ranks all styles and highlights those that offer the best investments.
Figure 4: Separating the Best ETFs From the Worst Funds
 Sources: New Constructs, LLC and company filings
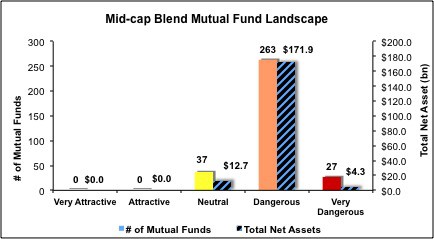
Figure 5: Separating the Best Mutual Funds From the Worst Funds
 Sources: New Constructs, LLC and company filings
Review my full list of ratings and rankings along with reports on all 16 ETFs and 327 mutual funds in the Mid Cap Blend style.
To protect your portfolio from the worst ETFs and mutual funds, click here for a free trial.
Kyle Guske II contributed to this report.
Disclosure: David Trainer and Kyle Guske II receive no compensation to write about any specific stock, sector, style or theme.