
The Mid Cap Value style ranks seventh out of the twelve fund styles as detailed in my Style Rankings for ETFs and Mutual Funds report. It gets Dangerous rating, which is based on aggregation of ratings of 12 ETFs and 194 mutual funds in the Mid Cap Value style as of April 22, 2014. Prior reports on the best & worst ETFs and mutual funds in every sector and style are here.
Figure 1 ranks from best to worst the nine mid-cap value ETFs that meet our liquidity standards and Figure 2 shows the five best and worst-rated mid-cap value mutual funds. Not all Mid Cap Value style ETFs and mutual funds are created the same. The number of holdings varies widely (from 31 to 2807), which creates drastically different investment implications and ratings. The best ETFs and mutual funds allocate more value to Attractive-or-better-rated stocks than the worst, which allocate too much value to Neutral-or-worse-rated stocks.
To identify the best and avoid the worst ETFs and mutual funds within the Mid Cap Value style, investors need a predictive rating based on (1) stocks ratings of the holdings and (2) the all-in expenses of each ETF and mutual fund. Investors need not rely on backward-looking ratings. My fund rating methodology is detailed here.
Investors should not buy any Mid Cap Value ETFs or mutual funds because none get an Attractive-or-better rating. If you must have exposure to this style, you should buy a basket of Attractive-or-better rated stocks and avoid paying undeserved fund fees. Active management has a long history of not paying off.
Get my ratings on all ETFs and mutual funds in this style by searching for Mid Cap Value on my mutual fund and ETF screener. For more products, click here.
Figure 1: ETFs with the Best & Worst Ratings
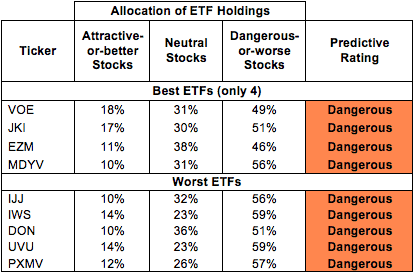 * Best ETFs exclude ETFs with TNAs less than $100 million for inadequate liquidity.
Sources: New Constructs, LLC and company filings
First Trust Mid Cap Value AlphaDEX Fund (FNK), Guggenheim S&P Midcap 400 Pure Value (RFV), and Vanguard S&P Mid-Cap 400 Value ETF (IVOV) are excluded from Figure 1 because their total net assets (TNA) are below $100 million and do not meet our liquidity standards.
Figure 2: Mutual Funds with the Best & Worst Ratings – Top 5
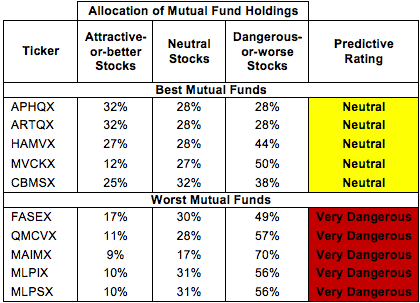 * Best mutual funds exclude funds with TNAs less than $100 million for inadequate liquidity.
Sources: New Constructs, LLC and company filings
Diamond Hill Funds: Diamond Hill Mid Cap Fund (DHPYX), Diamond Hill Funds: Diamond Hill Mid Cap Fund (DHPIX), and Neuberger Berman Eq Funds: Nueberger Berman MdCap Intrinsic Value Fd (NBRTX) are excluded from Figure 2 because their total net assets (TNA) are below $100 million and do not meet our liquidity standards.
Vanguard Mid-Cap Value ETF (VOE) is my top-rated Mid Cap Value ETF and Artisan Partners Funds, Inc: Artisan Mid Cap Value Fund (APHQX) is my top-rated Mid Cap Value mutual fund. VOE earns my Dangerous rating and APHQX earns my Neutral rating.
PowerShares RAFI Fundamental Pure Mid Value Portfolio (PXMV) is my worst rated Mid Cap Value ETF and ProFunds: Mid-Cap Value ProFund (MLPSX) is my worst-rated Mid Cap Value mutual fund. PXMV earns my Dangerous rating and MLPSX earns my Very Dangerous rating.
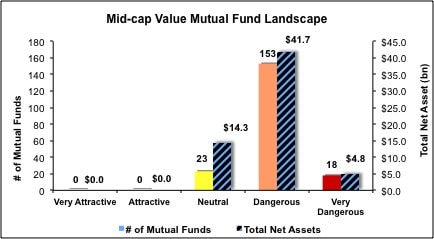
Figure 3 shows that 241 out of the 2160 stocks (over 16% of the market value) in Mid Cap Value ETFs and mutual funds get an Attractive-or-better rating. However, 0 out of 12 Mid Cap Value ETFs and 0 out of 194 Mid Cap Value mutual funds get an Attractive-or-better rating.
The takeaways are: mutual fund managers allocate too much capital to low-quality stocks and Mid Cap Value ETFs hold poor quality stocks.
Figure 3: Mid Cap Value Style Landscape For ETFs, Mutual Funds & Stocks
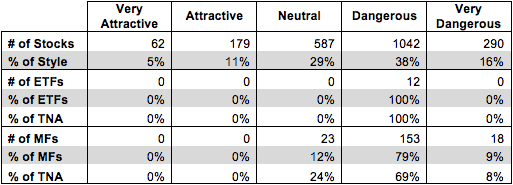 Sources: New Constructs, LLC and company filings
As detailed in “Low-Cost Funds Dupe Investors”, the fund industry offers many cheap funds but very few funds with high-quality stocks, or with what I call good portfolio management.
Investors need to tread carefully when considering Mid Cap Value ETFs and mutual funds, as no ETFs or mutual funds in the Mid Cap Value style allocate enough value to Attractive-or-better-rated stocks to earn an Attractive rating. Investors looking for exposure to this investment style would be better suited picking individual stocks.
CIGNA Corporation (CI) is one of my favorite stocks held by Mid Cap Value ETFs and mutual funds and earns my Very Attractive rating. CI also is a new addition to my Most Attractive Stocks list this month. Over the past decade, CI has grown after-tax profits (NOPAT) by 13% compounded annually. The company currently earns a return on invested capital (ROIC) of 12% and has generated positive economic earnings in nine of the last 10 years. At its current price of ~$77/share, CI has a price to economic book value (PEBV) ratio of 1.0. This ratio implies the market expects CI to never meaningfully grow NOPAT for the remainder of its corporate life. With a 10% CAGR in NOPAT over the past decade, expectations for no growth seem too low. Investors should take advantage.
Hartford Financial Services Group, Inc. (HIG) is one of my least favorite stocks held by Mid Cap Value ETFs and mutual funds and earns my Very Dangerous rating. Over the past nine years, HIG’s NOPAT declined by 25% compounded annually. At the same time, the company’s ROIC has fallen from 9% in 2004, down to a bottom quintile 0.4% in 2013. Making matters worse, even at its peak in 2006 the company failed to earn positive economic earnings. For all HIG’s struggles, the stock is priced for significant profit growth. To justify its current value of ~$35/share, HIG would need to grow NOPAT by 20% compounded annually for the next 32 years. These expectations are beyond optimistic for a company with rapidly declining NOPAT and profitability. Investors should avoid HIG.
Figures 4 and 5 show the rating landscape of all Mid Cap Value ETFs and mutual funds.
My Style Rankings for ETFs and Mutual Funds report ranks all styles and highlights those that offer the best investments.
Figure 4: Separating the Best ETFs From the Worst Funds
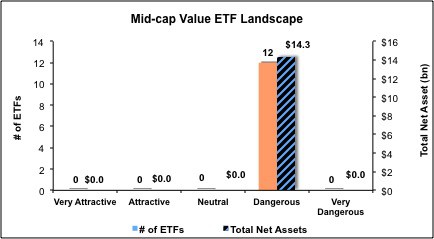 Sources: New Constructs, LLC and company filings
Figure 5: Separating the Best Mutual Funds From the Worst Funds
 Sources: New Constructs, LLC and company filings
Review my full list of ratings and rankings along with reports on all 12 ETFs and 194 mutual funds in the Mid Cap Value style.
To protect your portfolio from the worst ETFs and mutual funds, click here for a free trial.
Kyle Guske II contributed to this report.
Disclosure: David Trainer owns CI. David Trainer and Kyle Guske II receive no compensation to write about any specific stock, sector, style or theme.