
The Mid Cap Value style ranks tenth out of the twelve styles as detailed in my Style Rankings for ETFs and Mutual Funds report. It gets my Dangerous rating, which is based on aggregation of ratings of 11 ETFs and 184 mutual funds in the Mid Cap Value style as of January 28th, 2014. Prior reports on the best & worst ETFs and mutual funds in every style are here.
Figures 1 and 2 show the five best and worst-rated ETFs and mutual funds in the style. Not all Mid Cap Value style ETFs and mutual funds are created the same. The number of holdings varies widely (from 24 to 2807), which creates drastically different investment implications and ratings. The best ETFs and mutual funds allocate more value to Attractive-or-better-rated stocks than the worst ETFs and mutual funds, which allocate too much value to Neutral-or-worse-rated stocks.
To identify the best and avoid the worst ETFs and mutual funds within the Mid Cap Value style, investors need a predictive rating based on (1) stocks ratings of the holdings and (2) the all-in expenses of each ETF and mutual fund. Investors need not rely on backward-looking ratings. My fund rating methodology is detailed here.
Investors should not buy any Mid Cap Value ETFs or mutual funds because none get an Attractive-or-better rating. If you must have exposure to this style, you should buy a basket of Attractive-or-better rated stocks and avoid paying undeserved fund fees. Active management has a long history of not paying off. Here’s the list of our top-rated All Cap Growth stocks.
Get my ratings on all ETFs and mutual funds in this style on my free mutual fund and ETF screener.
Figure 1: ETFs with the Best & Worst Ratings – Top 5
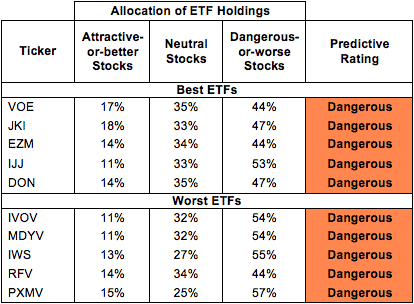 * Best ETFs exclude ETFs with TNAs less than $100 million for inadequate liquidity.
Sources: New Constructs, LLC and company filings
Figure 2: Mutual Funds with the Best & Worst Ratings – Top 5
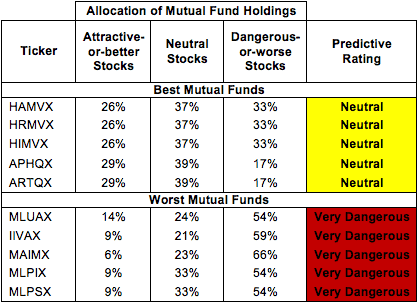 * Best mutual funds exclude funds with TNAs less than $100 million for inadequate liquidity.
Sources: New Constructs, LLC and company filings
Six mutual funds are excluded from Figure 2 because their total net assets (TNA) are below $100 million and do not meet our liquidity standards.
Vanguard Mid-Cap Value ETF (VOE) is my top-rated Mid Cap Value ETF and Westcore Trust: Westcore Harbor Funds: Harbor Mid Cap Value Fund (HAMVX) is my top-rated Mid Cap Value mutual fund. VOE earns my Dangerous rating while HAMVX earns my Neutral rating.
PowerShares RAFI Fundamental Pure Mid Value Portfolio (PXMV) is my worst-rated Mid Cap Value ETF and ProFunds: Mid-Cap Value ProFund (MLPSX) is my worst-rated Mid Cap Value mutual fund. PXMV earns my Dangerous rating while MLPSX earns my Very Dangerous rating.
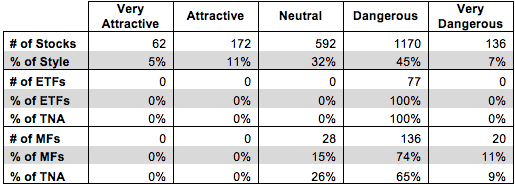
Figure 3 shows that 234 out of the 2132 stocks (over 16% of the market value) in Mid Cap Value ETFs and mutual funds get an Attractive-or-better rating. However, no Mid Cap Value ETFs or Mutual Funds get an Attractive-or-better rating.
The takeaways are: mutual fund managers allocate too much capital to low-quality stocks and Mid Cap Value ETFs hold poor quality stocks.
Figure 3: Mid Cap Value Style Landscape For ETFs, Mutual Funds & Stocks
 Sources: New Constructs, LLC and company filings
As detailed in “Low-Cost Funds Dupe Investors”, the fund industry offers many cheap funds but very few funds with high-quality stocks, or with what I call good portfolio management.
Investors need to tread carefully when considering Mid Cap Value ETFs and mutual funds, as no ETFs or mutual funds in the Mid Cap Value style allocate enough value to Attractive-or-better-rated stocks to earn an Attractive rating. Investors would be better off to focus on individual stocks instead.
Everest Re Group, Ltd. (RE) is one of my favorite stocks held by HAMVX and earns my Attractive rating. Everest has grown after-tax profits (NOPAT) by 23% compounded annually over the last 11 years. The company has increased its NOPAT margin to 14% from 10% in 2010. Everest also generates a return on invested capital (ROIC) of 12%, which ranks in the 2nd quintile among all 3000 companies I cover. Despite the strong cash flows and high ROIC, the future cash flow expectations priced into the stock are low. At the current trading price of ~$144/share, RE has a price-to-economic book value ratio (PEBV) of 0.7. This valuation implies that the market expects NOPAT to permanently decline by 30%. A 30% decline in NOPAT seems awfully pessimistic for a company with a NOPAT CAGR of 23% over the last 11 years. Strong, sustained profit growth and low expectations make RE a potentially attractive pick for investors.
SL Green Realty Corp (SLG) is one of my least favorite stocks held by Mid Cap Value ETFs and mutual funds and earns my Dangerous rating. SL Green Realty has seen its NOPAT decline by 10% compounded annually over the last five years, and the company generates a bottom-tier ROIC of just 4%. SL Green Realty has also had negative economic earnings in each of the last four years. One would imagine that a company with such a poor profit growth track record would be cheaply valued, but SLG has dangerously high expectations embedded into its price. To justify its current trading price of ~$92/share, SLG would have to grow NOPAT by 15% compounded annually over the next 10 years. The future profit growth expectations present an awfully high hurdle for a company whose profits have been declining in recent years. Investors should stay away from SLG.
Figures 4 and 5 show the rating landscape of all Mid Cap Value ETFs and mutual funds.
My Style Rankings for ETFs and Mutual Funds report ranks all styles and highlights those that offer the best investments.
Figure 4: Separating the Best ETFs From the Worst ETFs
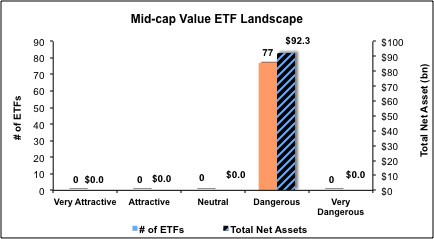 Sources: New Constructs, LLC and company filings
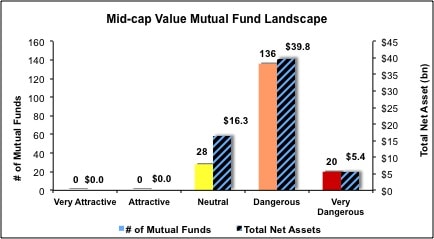
Figure 5: Separating the Best Mutual Funds From the Worst Mutual Funds
 Sources: New Constructs, LLC and company filings
Review my full list of ratings and rankings along with reports on all 11 ETFs and 184 mutual funds in the Mid Cap Value style.
Jared Melnyk contributed to this report.
Disclosure: David Trainer and Jared Melnyk receive no compensation to write about any specific stock, sector, style or theme.