
For those looking for the best financial analysis ratios in the business, you’ve come to the right place.
Harvard Business School (HBS) and MIT Sloan show that our first-ever database of footnotes disclosures provides superior data for measuring “core earnings”, a key element of NOPAT. See the Appendix of this paper for direct comparison of our analysis of NOPAT on a mega cap company to other major research providers.
We give you the financial due diligence needed to fulfill the Fiduciary Duty of Care.
Net operating profit after-tax (NOPAT) is the unlevered, after-tax operating cash generated by a business. It represents the true, normal and recurring profitability of a business. GAAP earnings or, even worse, non-GAAP earnings, are highly unreliable and are subject to misleading management manipulation.
As the numerator in our return on invested capital (ROIC) calculation, NOPAT is a very important value, and we place a great deal of importance on getting it right. Figure 1 provides the simplified formula for calculating NOPAT.
Figure 1: How to Calculate NOPAT – Simplified

Sources: New Constructs, LLC and company filings
When we calculate NOPAT, we make numerous adjustments to close accounting loopholes and ensure apples-to-apples comparability across thousands of companies. A company shouldn’t be able to hide its true performance, such as hidden, unusual losses.
Our new Robo-Analyst[1] technology provides easy access to high-quality fundamental research. There’s no reason for investors not to take advantage of best-in-class calculations of a firm’s recurring profits, e.g. NOPAT. Figure 2 shows the level of rigor that goes into our NOPAT calculation for all companies. We use our Uber (UBER) model as an example.
Note all clients who subscribe to our valuation models get access to detailed analysis like that in Figure 2. Our models also offer access to all our data in excel and audit-ability of all data back to the original 10-Ks and 10-Qs upon which our models are built.
Figure 2: How to Calculate NOPAT – Detailed
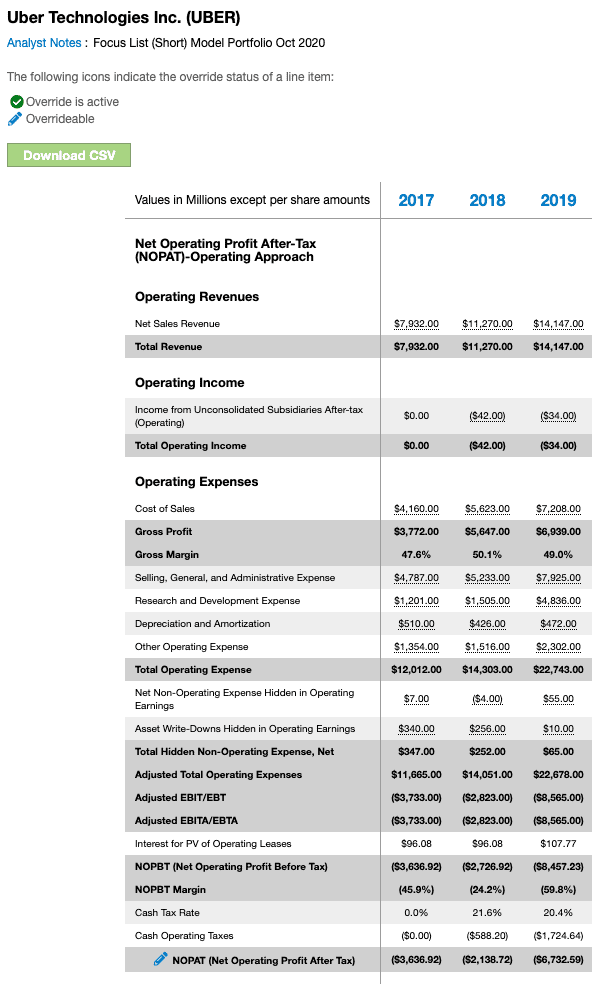
Sources: New Constructs, LLC and company filings
Breaking out each adjustment also allows us to reconcile reported GAAP net income with NOPAT. See Figure 3 for the reconciliation for UBER.
Figure 3: Adjustments to Reconcile GAAP Net Income to NOPAT: UBER
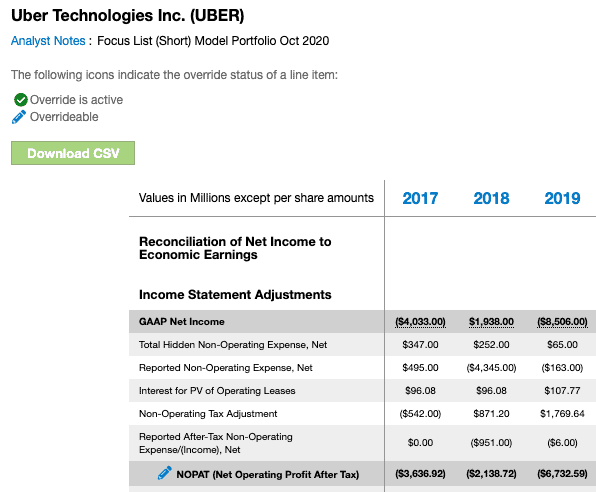
Sources: New Constructs, LLC and company filings
Figure 4 shows how we calculate NOPAT margin. NOPAT margin measures the amount of NOPAT generated from a firm’s total operating revenue and provides insights into the operating efficiency of a business.
Figure 4: How to Calculate NOPAT Margin
NOPAT / Total Operating Revenue = NOPAT Margin
Sources: New Constructs, LLC and company filings
Figure 5 shows the companies with the most under/overstated GAAP earnings as compared to NOPAT in fiscal 2018.
Figure 5: Companies with Most Understated/Overstated Earnings in Fiscal 2018
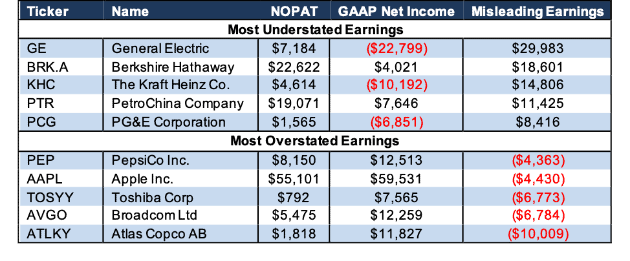
Sources: New Constructs, LLC and company filings. Only includes companies with positive NOPAT
Per Figure 5, Atlas Copco AB’s (ATLKY) NOPAT is $10 billion less than its reported GAAP earnings. Our NOPAT calculation for ATLKY can be seen here. The large disconnect between reported earnings and NOPAT stems from over $10 billion in profit from discontinued operations recorded on the income statement in 2018. When calculating NOPAT, we remove all income and losses from discontinued operations as this income/loss will not recur in the future.
PepsiCo (PEP), Apple Inc. (AAPL), Toshiba Corp (TOSYY), and Broadcom (AVGO) also have significantly overstated GAAP net income after adjusting for non-operating expenses, expenses or income hidden in operating earnings, asset write downs, and more. You can see exactly how we reconcile Toshiba Corp’s GAAP net income to NOPAT here.
On the other hand, General Electric’s (GE) net income greatly understates its NOPAT. See our NOPAT calculation for GE here. In 2018, General Electric had $3.5 billion in operating expense hidden in operating earnings and over $1.8 billion in hidden write downs, along with another $22.1 billion in write-downs disclosed directly on the income statement. We remove each of these non-recurring items from our NOPAT calculation. To ensure profitability metrics aren’t distorted, our models capture the after-tax value of write-downs in invested capital.
Berkshire Hathaway (BRK.A), The Kraft Heinz Co. (KHC), PetroChina Company (PTR), and PG&E Corporation (PCG) each reported GAAP net income that understated the true recurring profits of their business operations in fiscal 2018. However, understated earnings alone don’t mean a stock is worthy of investment. Four stocks with the most understated earnings in Figure 5 receive a Neutral-or-worse rating.
Our models and calculations are 100% transparent because we want our clients to know how much work we do to ensure we give them the best earnings quality and valuation models in the business.
This article originally published on November 19, 2019.
Disclosure: David Trainer and Kyle Guske II receive no compensation to write about any specific stock, sector, style, or theme.
[1] HBS features our technology, the only technology that brings material footnotes data to investors, in the case study: “New Constructs: Disrupting Fundamental Analysis with Robo-Analysts.”