
We’re excited to announce that we added display of quarterly and trailing-twelve month (TTM) data & analytics to the Financials and Metrics pages of our Company Valuation Models.
Figure 1 shows the display options for each of the pages with historical data in our models.
Annual data is based on the data in a company’s 10-K annual filings.
Quarterly data is based on the data in a company’s 10-Q filings for quarters one through three. For 4Q, income statement items are estimated based on the 10-K while 4Q balance sheets are based on the 10-K.
TTM data is based on the prior 12 months of financial data (from both 10-Qs and 10-Ks) for each period.
Figure 1: View Annual, Quarterly, and TTM Data in Our Company Models
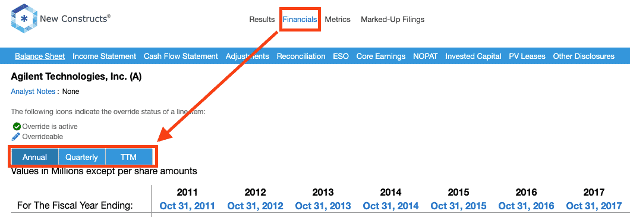
Sources: New Constructs, LLC and company filings.
Per Figure 2, the type of data displayed is indicated by a dark blue color in the selection boxes, as well as the text to the left of the date periods. “Fiscal Year Ending” indicates Annual data, “Fiscal Quarter Ending” indicates Quarterly data, and “TTM Period Ending” indicates TTM data.
Figure 2: View TTM Data in Our Company Models
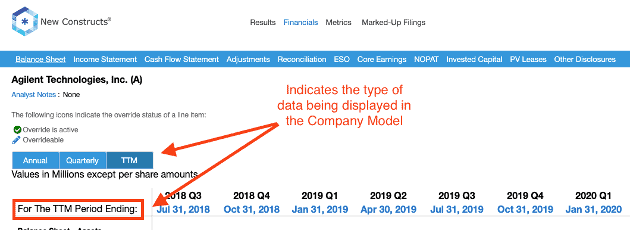
Sources: New Constructs, LLC and company filings.
Figure 3 shows the income statement adjustments we make to calculate net operating profit after-tax (NOPAT) on a quarterly basis. The date in blue, below each year and quarter, is the period end date for each quarter.
Figure 3: View Quarterly Data in Our Company Models
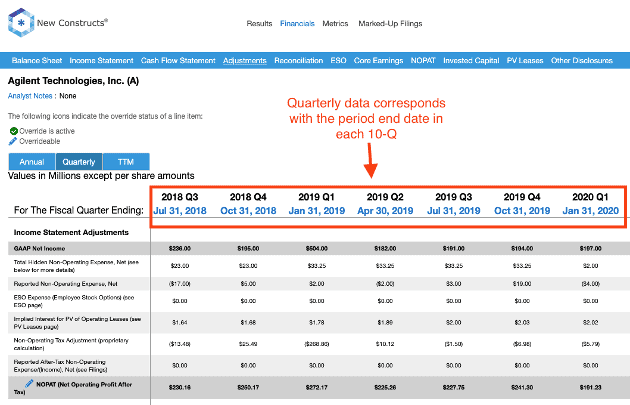
Sources: New Constructs, LLC and company filings.
Please contact us at support@newconstructs.com if you have any questions.
This article originally published on November 12, 2020.
Disclosure: David Trainer, Kyle Guske II, and Matt Shuler receive no compensation to write about any specific stock, style, or theme.
Follow us on Twitter, Facebook, LinkedIn, and StockTwits for real-time alerts on all our research.