
Street Earnings, as reflected in Zacks Earnings, are marketed as being adjusted to remove non-recurring items. Our Core Earnings[1] show Street Earnings fail to account for a material amount of unusual items, which distorts investor’s view of profitability across the S&P 500. This report shows:
- the prevalence and magnitude of overstated Street Earnings in the S&P 500
- why Street Earnings (and GAAP earnings) are flawed and not adjusted as promised
- five S&P 500 companies with overstated Street Earnings and a Very Unattractive Stock Rating
Over 180 S&P 500 Companies Overstate EPS by More than 10%
For 339 companies in the S&P 500, or 68%, Street Earnings overstate Core Earnings[2] for the trailing-twelve-months (TTM) ended 3Q22. In the TTM ended 2Q22, 341 companies overstated their earnings.
When Street Earnings overstate Core Earnings they do so by an average of 19%, per Figure 1. For over a third of the S&P 500 (186 companies), Street Earnings overstate Core Earnings by more than 10%.
Figure 1: Street Earnings Overstated by 19% on Average in TTM Through 3Q22[3]

Sources: New Constructs, LLC and company filings.
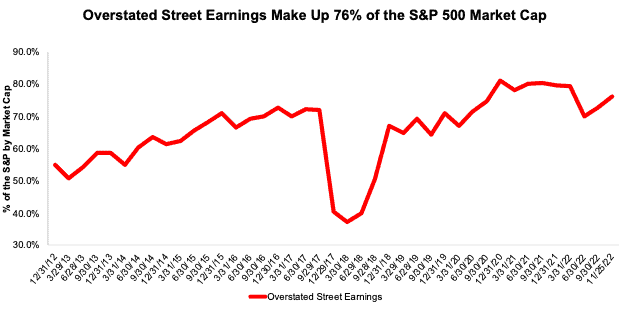
The 339 companies with overstated Street Earnings make up 76% of the market cap of the S&P 500 as of 11/25/22, which is up from 73% in 2Q22, measured with TTM data in each quarter.
Figure 2: Overstated Street Earnings as % of Market Cap: 2012 through 11/25/22
Sources: New Constructs, LLC and company filings.
The Five Worst Offenders in the S&P 500
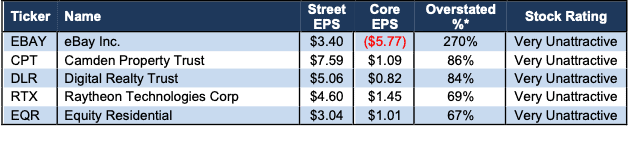
Figure 3 shows five S&P 500 stocks with a Very Unattractive Stock Rating and the most overstated Street Earnings (Street Distortion as a % of Street Earnings per share) over the TTM through 3Q22, excluding Real Estate. “Street Distortion” equals the difference between Core Earnings per share and Street Earnings per share. Investors using Street Earnings miss the true profitability, or lack thereof, of these businesses.
Figure 3: S&P 500 Companies with Most Overstated Street Earnings: TTM Through 3Q22
Sources: New Constructs, LLC and company filings.
*Measured as Street Distortion as a percent of Street EPS.
In the section below, we detail the hidden and reported unusual items that distort GAAP Earnings for Digital Realty (DLR). All of these unusual items are removed from Core Earnings.
Digital Realty (DLR) TTM 3Q22 Street Earnings Overstated by $4.24/share
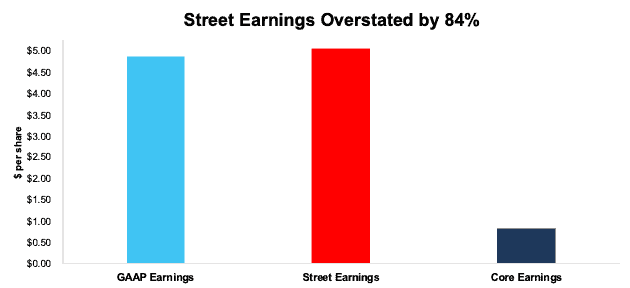
The difference between, or Street Distortion in, Digital Realty’s Street Earnings ($5.06/share) and Core Earnings ($0.82/share) is $4.24/share, or 84% percent of Street Earnings.
Digital Realty’s GAAP Earnings overstate Core Earnings by $4.05/share, which indicates that Street Earnings are even more overstated and miss more of the unusual items that distort GAAP Earnings for Digital Realty.
Figure 4: Comparing Digital Realty’s GAAP, Street, and Core Earnings: TTM Through 3Q22
Sources: New Constructs, LLC and company filings.
Below, we detail the differences between Core Earnings and GAAP Earnings so readers can audit our research. We would be happy to reconcile our Core Earnings with Street Earnings but cannot because we do not have the details on how analysts calculate Street Earnings.
Digital Realty’s Earnings Distortion Score is Strong Miss, its Stock Rating is Very Unattractive and we put it in the Danger Zone in May 2022. Digital Realty receives a Very Unattractive rating largely due to its low return on invested capital (ROIC) of 2% and the expensive valuation of its stock. Despite trading at $107/share DLR has an economic book value (EBV), or no growth value, of -$29/share.
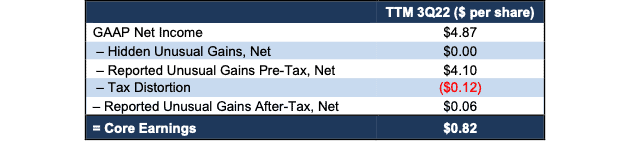
Figure 5 details the differences between Digital Realty’s Core Earnings and GAAP Earnings.
Figure 5: Digital Realty’s GAAP Earnings to Core Earnings Reconciliation: TTM Through 3Q22
Sources: New Constructs, LLC and company filings.
More details:
Total Earnings Distortion of $4.05/share, which equals $1.2 billion, is comprised of the following:
Reported Unusual Gains Pre-Tax, Net = $4.10/per share, which equals $1.2 billion and is comprised of:
- $1.2 billion in gains on disposition of properties in the TTM period based on
- $174 million in 3Q22
- $3 million in 1Q22
- $1.0 billion in 4Q21
- $27.5 million in other income in the TTM period based on
- $16 million income in 3Q22
- $13 million income in 2Q22
- $3 million income in 1Q22
- -$4 million expense in 4Q21
- -$18 million in impairments of investments in real estate in 4Q21
- -$51.5 million in losses on early extinguishment of debt in the TTM period based on
- -$51 million in 1Q22
- <-$1 million in 4Q21
Tax Distortion = -$0.12/per share, which equals -$34.1 million
Reported Unusual Gains After-Tax, Net = $0.06/per share, which equals $18 million and is comprised of:
- $18 million gain on redemption of preferred stock in 4Q21
This article was originally published on December 13, 2022.
Disclosure: David Trainer, Kyle Guske II, Matt Shuler, and Italo Mendonça receive no compensation to write about any specific stock, style, or theme.
Follow us on Twitter, Facebook, LinkedIn, and StockTwits for real-time alerts on all our research.
[1] The Journal of Financial Economics features the superiority of our Core Earnings in Core Earnings: New Data & Evidence.
[2] Our Core Earnings research is based on the latest audited financial data, which is the calendar 3Q22 10-Q in most cases. Price data as of 11/25/22.
[3] Average overstated % is calculated as Street Distortion, which is the difference between Street Earnings and Core Earnings.