
GAAP Earnings exaggerated the drop in 2020 and overstated the rebound in S&P 500 earnings in 2021. We see the same trends in Street Earnings, as reflected in Zacks Earnings, which are reported to be adjusted to remove non-recurring items using standardized assumptions from the sell-side. This report shows:
- the prevalence and magnitude of overstated Street Earnings in the S&P 500
- why Street Earnings (and GAAP earnings) are flawed
- five S&P 500 companies with overstated Street Earnings and a Very Unattractive Stock Rating
- how Core Earnings[1] and our Earnings Distortion factor provide a new source of alpha
Over 160 S&P 500 Companies Overstate EPS by More than 10%
For 336 companies in the S&P 500, Street Earnings overstated Core Earnings[2] for the trailing-twelve-months (TTM) ended calendar 2021. In the TTMs ended 3Q21 and 4Q20, even more, 360 companies and 351 companies overstated their earnings. When Street Earnings overstate Core Earnings, they do so by an average of 21% per company, per Figure 1. For over a third of S&P 500 companies, Street Earnings overstate Core Earnings by >10%.
Figure 1: Street Earnings Overstated by 21% on Average in 2021[3]

Sources: New Constructs, LLC and company filings.
The 336 companies with overstated Street Earnings make up 79% of the market cap of the S&P 500, which is the fifth-highest percent since 2012 (earliest data available), measured with TTM data in each quarter. Figure 2 shows that roughly 80%, by market cap, of the S&P 500 has overstated earnings for most of the last two years.
Figure 2: Overstated Street Earnings as % of Market Cap: 2012 through 3/11/22
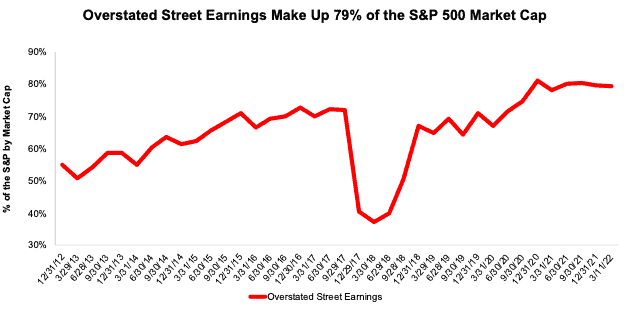
Sources: New Constructs, LLC and company filings.
The Five Worst Offenders in the S&P 500
Figure 3 shows five S&P 500 stocks with a Very Unattractive Stock Rating and the most overstated Street Earnings (Street Distortion as a % of Street Earnings per share) over the TTM through 4Q21. “Street Distortion” equals the difference between Core Earnings per share and Street Earnings per share. Investors using Street Earnings miss the true profitability, or lack thereof, of these businesses.
Figure 3: S&P 500 Companies with Most Overstated Street Earnings: 2021
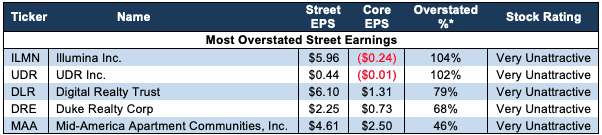
Sources: New Constructs, LLC and company filings.
*Measured as Street Distortion as a percent of Street EPS
In the section below, we detail the hidden and reported unusual items that distort GAAP Earnings for Illumina Inc. (ILMN), one of the stocks in March’s Most Dangerous Stocks Model Portfolio. All these unusual items are removed from Core Earnings.
Illumina’s (ILMN) 2021 Street Earnings Overstated by $6.20/share
The difference between Illumina’s Street Earnings ($5.96/share) and Core Earnings (-$0.24/share) is 6.20/share, per Figure 4. That difference is the Street Distortion, which for Illumina is 104% percent of Street Earnings.
Illumina’s GAAP Earnings overstate Core Earnings by $5.29/share. Street Earnings are more distorted by unusual items than GAAP earnings for Illumina.
Figure 4: Comparing Illumina’s GAAP, Street, and Core Earnings: 2021
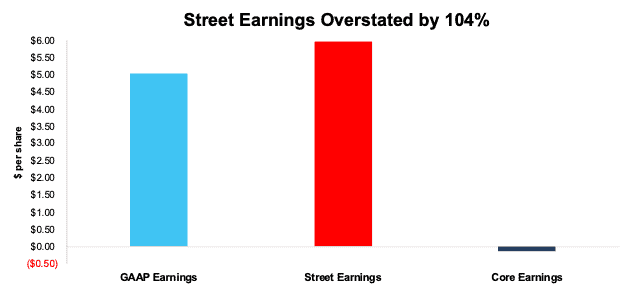
Sources: New Constructs, LLC and company filings.
Below, we detail the differences between Core Earnings and GAAP Earnings so readers can audit our research. We would be happy to reconcile our Core Earnings with Street Earnings but cannot because we do not have the details on how analysts calculate their Street Earnings.
Illumina’s Earnings Distortion Score is Strong Miss and its Stock Rating is Very Unattractive. As noted above, Illumina is in March’s Most Dangerous Stocks Model Portfolio due to its overstated earnings and expensive valuation. Despite trading at $364/share, ILMN has an economic book value (EBV), or no growth value, of -$2/share.
Figure 5 details the differences between Illumina’s Core Earnings and GAAP Earnings.
Figure 5: Illumina’s GAAP Earnings to Core Earnings Reconciliation: 2021

Sources: New Constructs, LLC and company filings.
More details:
Total Earnings Distortion of $5.28/share, which equals $798 million, is comprised of the following:
Reported Unusual Gains Pre-Tax, Net = $7.07/per share, which equals $1.1 billion. Each of the below items was bundled in Other Income on Illumina’s income statement. We relied on the breakout of Other Income on page 78 of its 2021 10-K to learn that it contained:
- $899 million gain on previously held investment in GRAIL
- $86 million gain on exchange of GRAIL contingent value rights
- $30 million gain on Helix contingent value right
- $26 million gain on derivative assets related to terminated acquisition
- $18 million gain on strategic investments, net
- $9 million in “other” income
Hidden Unusual Expenses, Net = -$0.93/per share, which equals -$141 million and is comprised of
- -$156 million in transaction costs related to the acquisition of GRAIL bundled in SG&A – Page 68
- -$1 million expense due to the change in estimated fair value of contingent consideration bundled in SG&A – Page 65
- $16 million in sublease income – Page 73
Tax Distortion = -$0.85/per share, which equals -$129 million
Given the similarities between Street Earnings for Illumina and GAAP Earnings, our research shows both Street and GAAP earnings fail to capture significant unusual items both hidden and reported directly on Illumina’s income statement.
Check out this week’s Danger Zone interview with Chuck Jaffe of Money Life.
This article originally published on April 4, 2022.
Disclosure: David Trainer, Kyle Guske II, and Matt Shuler receive no compensation to write about any specific stock, style, or theme.
Follow us on Twitter, Facebook, LinkedIn, and StockTwits for real-time alerts on all our research.
[1] The Journal of Financial Economics features the superiority of our Core Earnings in Core Earnings: New Data & Evidence.
[2] Our Core Earnings research is based on the latest audited financial data, which is the calendar 2021 10-K in most cases
[3] Average overstated % is calculated as Street Distortion, which is the difference between Street Earnings and Core Earnings.