
Our report on Overstated Street Earnings in 2022 shows Street Earnings (based on Zacks Earnings) overstate profits for the majority of S&P 500 companies in 2022. However, there are over 150 S&P 500 companies whose 2022 Street Earnings are lower than their true profits, i.e. Core Earnings[1],[2]. These companies are more profitable than investors realize and, in many cases, undervalued.
This report shows:
- the magnitude of understated Street Earnings in the S&P 500
- why Street Earnings (and GAAP earnings) are flawed
- five S&P 500 companies with understated Street Earnings and Very Attractive Stock Ratings
Over 150 S&P 500 Companies Have Understated Street Earnings
For 154 companies in the S&P 500, or 31%, Street Earnings are lower than Core Earnings in the TTM ended 4Q22. In the TTM ended 3Q22, Street Earnings were understated for 143 companies.
When Street Earnings are lower than Core Earnings, they are understated by an average of 18% per company, per Figure 1. For 10% of the S&P 500 (50 companies), Street Earnings are understated by more than 10% vs. Core Earnings.
Figure 1: Street Earnings Understated by 18% on Average in 2022[3]

Sources: New Constructs, LLC and company filings.
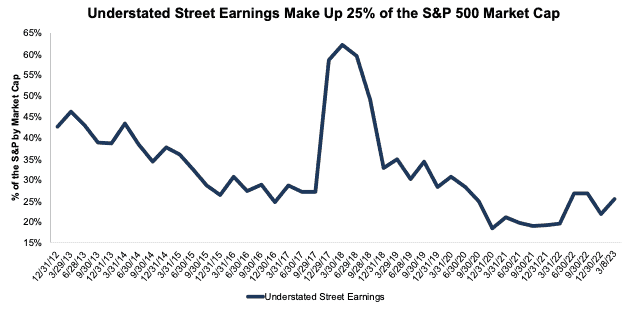
The 154 companies with understated Street Earnings represent 25% of the market cap of the S&P 500 as of 3/8/23, which is up from 22% in the TTM ended 3Q22.
Figure 2: Understated Street Earnings as % of Market Cap: 2012 through 3/8/23
Sources: New Constructs, LLC and company filings.
The Five Most Understated Earnings in the S&P 500
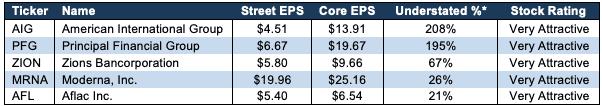
Figure 3 shows five S&P 500 stocks with Very Attractive Stock Ratings and the most understated Street Earnings (based on Street Distortion as a % of Street Earnings per share) in the TTM ended 4Q22. “Street Distortion” equals the difference between Core and Street Earnings on a per share basis. Investors relying only on Street Earnings miss the true profitability of these businesses.
Figure 3: S&P 500 Companies with Most Understated Street Earnings: 2022
Sources: New Constructs, LLC and company filings.
*Measured as Street Distortion as a percent of Street EPS
In the section below, we detail the hidden and reported unusual items that distort GAAP Earnings for Moderna (MRNA). All these unusual items are removed from Core Earnings.
Moderna’s 2022 Street Earnings Understated by $5.20/share
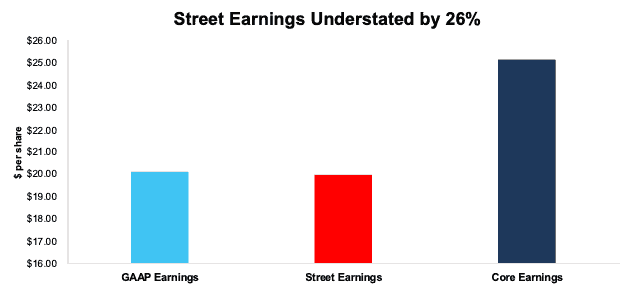
The difference between, or Street Distortion in, Moderna’s 2022 Street Earnings ($19.96/share) and Core Earnings ($25.16/share) is $5.20/share, or 26% of Street Earnings.
Moderna’s 2022 GAAP Earnings ($20.10/share) are $5.06/share lower than Core Earnings, which indicates that Street Earnings are even more understated and miss more of the unusual items that distort GAAP Earnings for Moderna. Our proprietary process for adjusting financial filings corrects these inaccuracies and reflects true profitability.
Figure 4: Comparing Moderna’s GAAP, Street, and Core Earnings: 2022
Sources: New Constructs, LLC and company filings.
Below, we detail the differences between Core Earnings and GAAP Earnings so readers can audit our research. We would be happy to reconcile our Core Earnings with Street Earnings but cannot because we do not have the details on how analysts calculate their Street Earnings.
Moderna’s Earnings Distortion Score is Strong Beat and its Stock Rating is Very Attractive, in part due to its return on invested capital (ROIC) of 247% and price-to-economic book value (PEBV) ratio of 0.3.
Figure 5 details the differences between Moderna’s Core Earnings and GAAP Earnings.
Figure 5: Moderna’s GAAP Earnings to Core Earnings Reconciliation: 2022

Sources: New Constructs, LLC and company filings.
More details:
Total Earnings Distortion of -$5.06/share, which equals -$2.1 billion, is comprised of the following:
Hidden Unusual Expenses, Net = -$4.61/per share, which equals -$1.9 billion and is comprised of:
- -$1.3 billion in inventory write-downs recorded in cost of sales
- -$617 million in losses on firm purchase commitments recorded in cost of sales
Reported Unusual Expenses, Net = -$0.04/per share, which equals -$16 million and is comprised of:
- -$20 million loss on investments
- $4 million in other income
Tax Distortion = -$0.41/per share, which equals $171 million
The similarities between Street Earnings and GAAP Earnings for Moderna indicate that Street Earnings miss many of the unusual items in GAAP Earnings. The $5.20/share Street Distortion highlights that Core Earnings include a more comprehensive set of unusual items when calculating Moderna’s true profitability.
This article was originally published on March 30, 2023.
Disclosure: David Trainer, Kyle Guske II, and Italo Mendonça receive no compensation to write about any specific stock, style, or theme.
Questions on this report or others? Join our free learning platform and connect with our experts directly.
[1] The Journal of Financial Economics features the superiority of our Core Earnings in Core Earnings: New Data & Evidence.
[2] Our Core Earnings research is based on the latest audited financial data, which is the calendar 2022 10-K in most cases. Price data as of 3/8/23.
[3] Average understated % is calculated as Street Distortion, which is the difference between Street Earnings and Core Earnings.