
Street Earnings (based on Zacks Earnings) overstate profits for the majority of S&P 500 companies, as shown in our note on Overstated Street Earnings in 2Q22. However, there are many S&P 500 companies whose Street Earnings understate their true profits. These companies are more profitable than investors realize and, in most cases, undervalued as well.
This report shows:
- the prevalence and magnitude of understated Street Earnings in the S&P 500
- why Street Earnings (and GAAP earnings) are flawed
- five S&P 500 companies with understated Street Earnings and Very Attractive Stock Ratings
Over 150 S&P 500 Companies Have Understated Street Earnings
For 153 companies in the S&P 500, or 31%, Street Earnings understate Core Earnings[1],[2] for the trailing-twelve-months (TTM) ended calendar 2Q22. In the TTMs ended 2Q21, 120 companies understated their earnings.
When Street Earnings understate Core Earnings, they do so by an average of -15% per company, per Figure 1. Street Earnings understate Core Earnings by more than 10% for ~10% of S&P 500 companies.
Figure 1: Street Earnings Understated by -15% on Average in TTM Through 2Q22[3]

Sources: New Constructs, LLC and company filings.
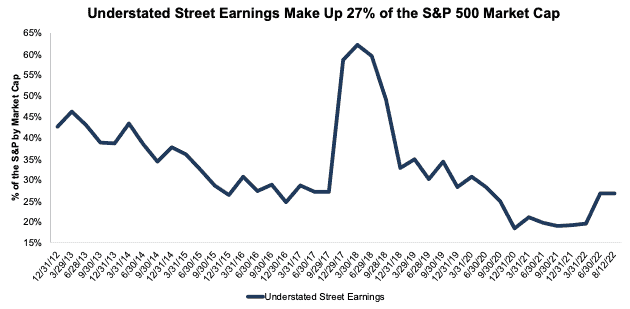
The 153 companies with understated Street Earnings represent 27% of the market cap of the S&P 500 as of 8/12/22, which is the same as through 1Q22, measured with TTM data in each quarter.
Figure 2: Understated Street Earnings as % of Market Cap: 2012 through 8/12/22
Sources: New Constructs, LLC and company filings.
The Five Most Understated Earnings in the S&P 500
Companies that understate earnings are rarer than in years past, but you can find them if you know where to look.
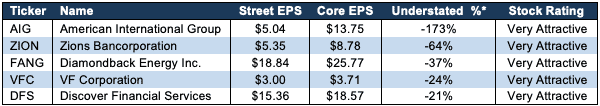
Figure 3 shows five S&P 500 stocks with Very Attractive Stock Ratings and the most understated Street Earnings (based on Street Distortion as a % of Street Earnings per share) over the TTM through 2Q22. “Street Distortion” equals the difference between Core Earnings per share and Street Earnings per share. Investors using Street Earnings miss the true profitability of these businesses.
Figure 3: S&P 500 Companies with Most Understated Street Earnings: TTM Through 2Q22
Sources: New Constructs, LLC and company filings.
*Measured as Street Distortion as a percent of Street EPS
In the section below, we detail the hidden and reported unusual items that distort GAAP Earnings for VF Corporation (VFC). All these unusual items are removed from Core Earnings.
VF Corporation’s (VFC) TTM 2Q22 Street Earnings Understated by $0.71/share
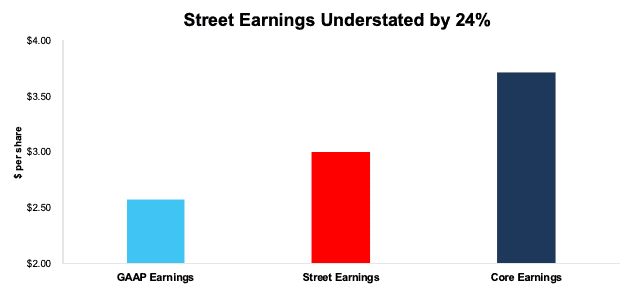
The difference between VF Corporation’s TTM 2Q22 Street Earnings ($3.00/share) and Core Earnings ($3.71/share) is $0.71/share, per Figure 4. We call that difference “Street Distortion,” which equals 24% of Street Earnings.
VF Corporation’s TTM 2Q22 GAAP Earnings ($2.58/share) understate Core Earnings by $1.14/share.
This example shows how Street Earnings suffer from many of the same shortcomings as GAAP measures of earnings. Our proprietary process for gathering and adjusting financial filings overcomes these shortcomings.
Figure 4: Comparing VF Corporation’s GAAP, Street, and Core Earnings: TTM Through 2Q22
Sources: New Constructs, LLC and company filings.
Below, we detail the differences between Core Earnings and GAAP Earnings so readers can audit our research. We would be happy to reconcile our Core Earnings with Street Earnings but cannot because we do not have the details on how analysts calculate their Street Earnings.
VF Corporation’s Earnings Distortion Score is Strong Beat and its Stock Rating is Very Attractive, in part due to its return on invested capital (ROIC) of 11% and price-to-economic book value (PEBV) ratio of 0.9.
Figure 5 details the differences between VF Corporation’s Core Earnings and GAAP Earnings.
Figure 5: VF Corporation’s GAAP Earnings to Core Earnings Reconciliation: TTM Through 2Q22

Sources: New Constructs, LLC and company filings.
More details:
Total Earnings Distortion of -$1.14/share, which equals -$444 million, is comprised of the following:
Hidden Unusual Expenses, Net = -$1.11/per share, which equals -$436 million and is comprised of
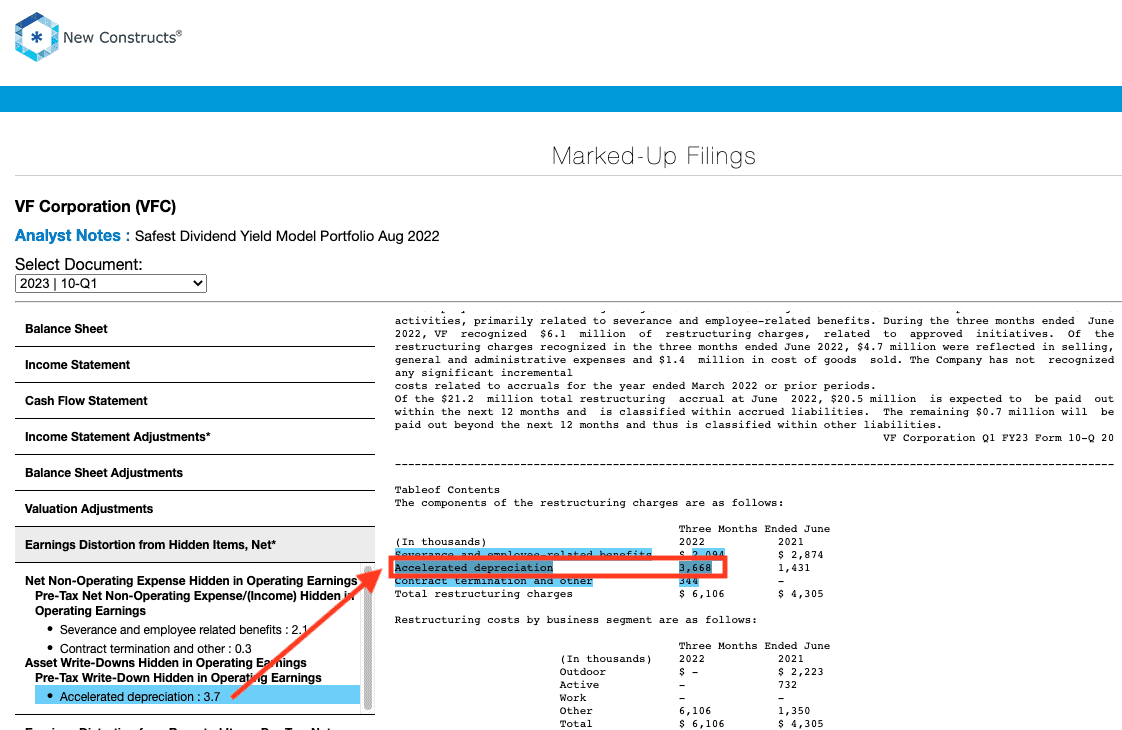
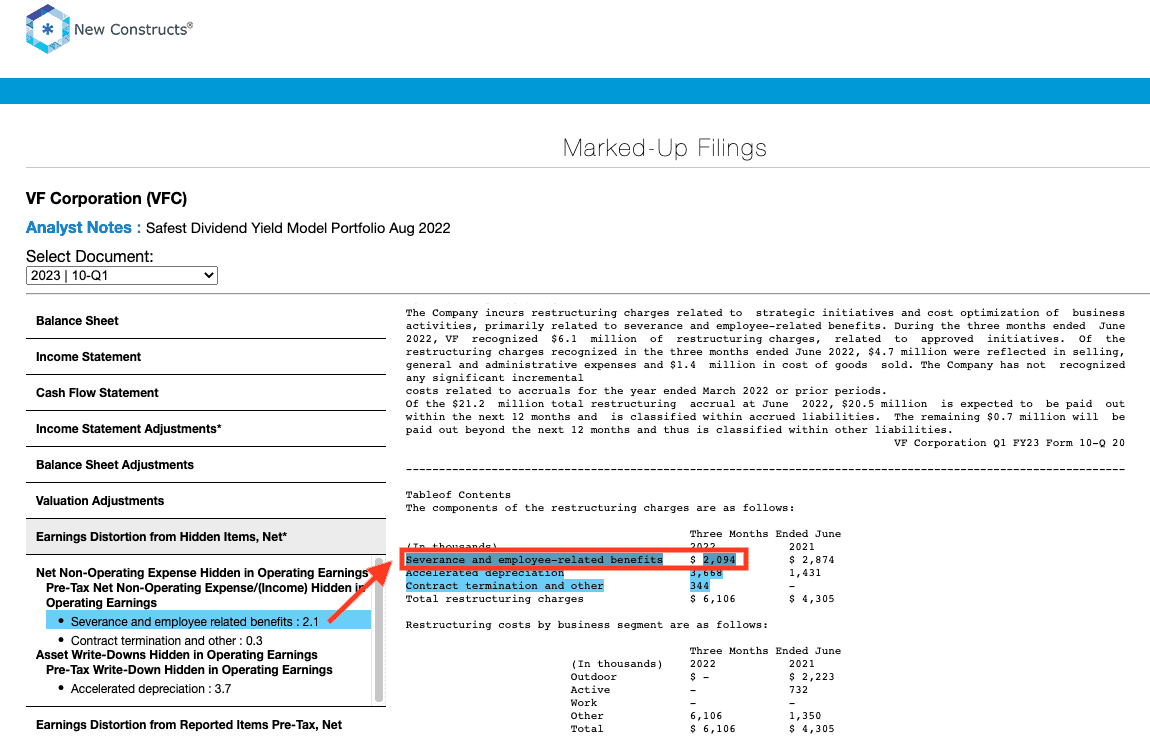
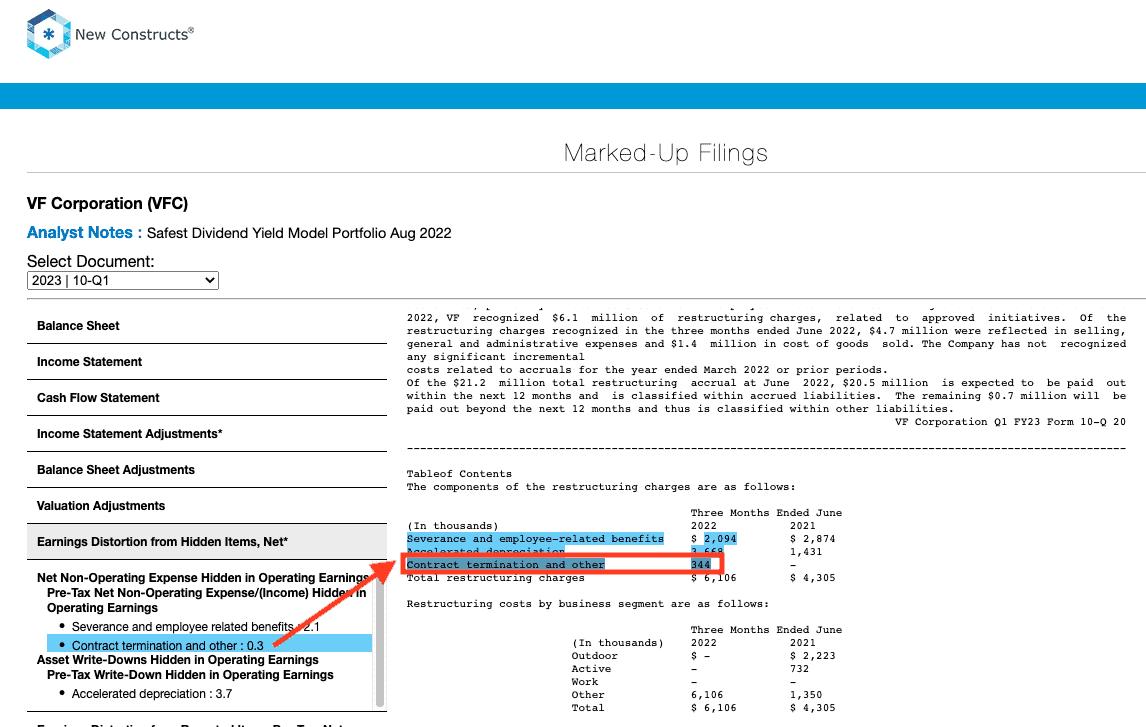
- -$436 million in hidden restructuring expenses in the TTM period based on
- -$4 million in accelerated depreciation in fiscal 1Q23
- -$2 million in severance and employee related benefits in fiscal 1Q23
- -$0.3 million in contract termination and other charges in fiscal 1Q23
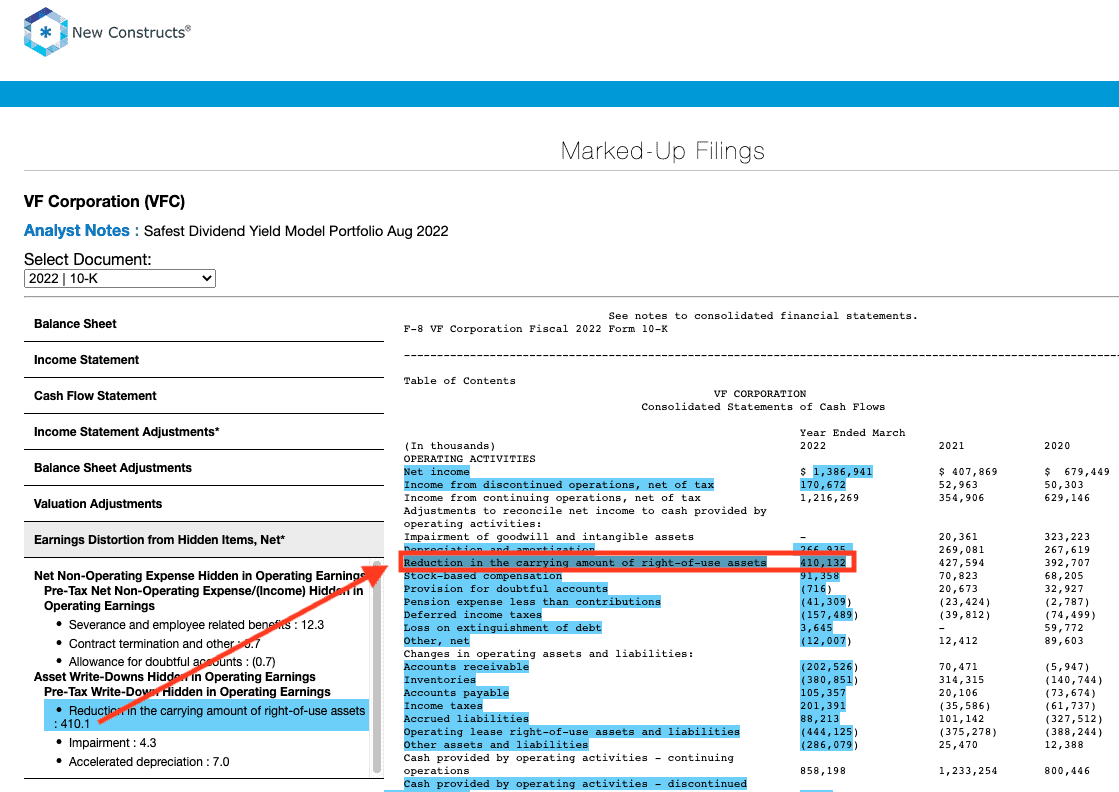
- -$410 million reduction in the carrying amount of right-of-use assets in fiscal 4Q22
- -$3 million in accelerated depreciation in fiscal 4Q22
- -$5 million in severance and employee related benefits in fiscal 4Q22
- -$0.7 million in contract termination and other charges in fiscal 4Q22
- -$4 million impairment recorded in lease costs in fiscal 4Q22
- -$0.6 million in accelerated depreciation in fiscal 3Q22
- -$3 million in severance and employee-related benefits in fiscal 3Q22
- -$2 million in accelerated deprecation in fiscal 2Q22
- -$1 million in severance and employee-related benefits in fiscal 2Q22
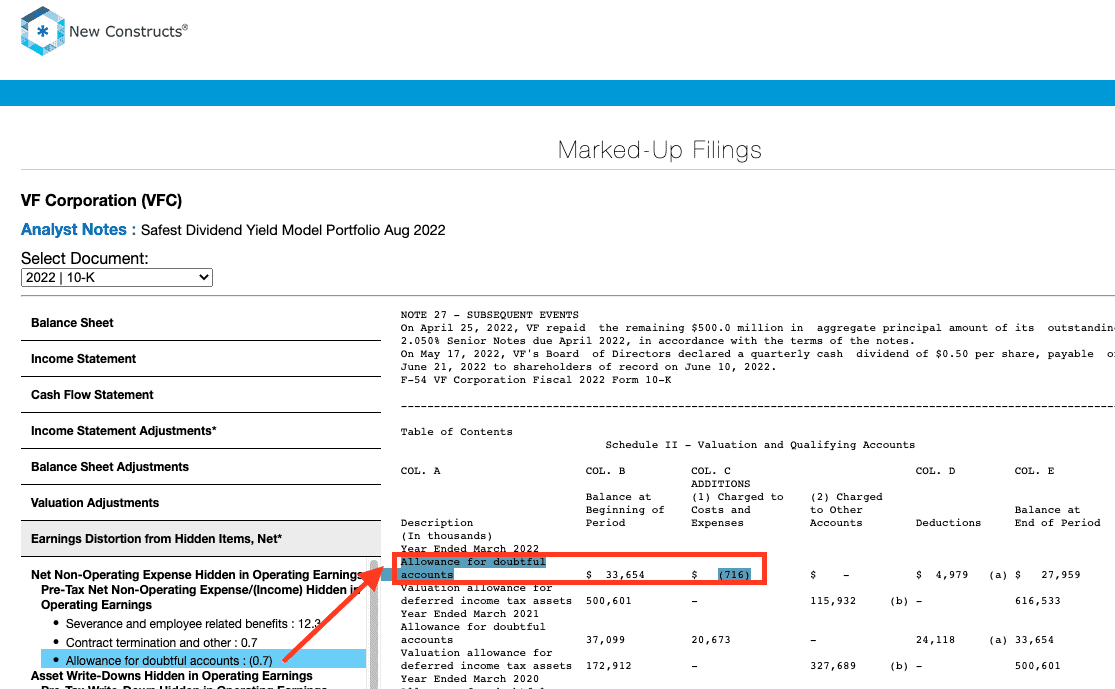
- $0.5 million in the TTM period based on $0.7 million reduction to allowance for doubtful accounts in fiscal 2022 10-K
Reported Unusual Expenses Pre-Tax, Net = -$0.27/per share, which equals -$105 million and is comprised of
- -$78 million in other expense in the TTM period based on
- -$95 million expense in fiscal 1Q23
- $10 million income in fiscal 4Q22
- -$0.1 million expense in fiscal 3Q22
- $8 million income in fiscal 2Q22
- -$4 million loss on debt extinguishment in fiscal 3Q22
- $24 million contra adjustment for recurring pension costs. These recurring expenses are reported in non-recurring line items, so we add them back and exclude them from Earnings Distortion.
Tax Distortion = $0.25/per share, which equals $96 million
Reported Unusual Expenses After-Tax, Net = <$0.01/per share, which equals $399 thousand and is comprised of
- $0.4 million income from discontinued operations in fiscal 4Q22
While not equal, the similarities between Street Earnings and GAAP Earnings for VF Corporation indicates that Street Earnings miss many of the unusual items in GAAP Earnings, and the $0.71/share Street Distortion highlights that Core Earnings include a more comprehensive set of unusual items when calculating VF Corporation’s true profitability.
This article originally published on August 26, 2022
Disclosure: David Trainer, Kyle Guske II, Matt Shuler, and Brian Pellegrini receive no compensation to write about any specific stock, style, or theme.
Follow us on Twitter, Facebook, LinkedIn, and StockTwits for real-time alerts on all our research.
[1] The Journal of Financial Economics features the superiority of our Core Earnings in Core Earnings: New Data & Evidence.
[2] Our Core Earnings research is based on the latest audited financial data, which is the calendar 2Q22 10-Q in most cases. Price data as of 8/12/22.
[3] Average understated % is calculated as Street Distortion, which is the difference between Street Earnings and Core Earnings.