
While Street Earnings (based on Zacks Earnings) overstate profits for the majority of S&P 500 companies, as shown in Street Earnings Overstated for 67% of S&P 500 Companies in 1Q22, there are also many S&P 500 companies whose Street Earnings understate their true profits. These companies are more profitable than investors realize and, in most cases, undervalued as well.
This report shows:
- the prevalence and magnitude of understated Street Earnings in the S&P 500
- why Street Earnings (and GAAP earnings) are flawed
- five S&P 500 companies with understated Street Earnings and Very Attractive Stock Ratings
Over 150 S&P 500 Companies Have Understated Street Earnings
For 152 companies in the S&P 500, Street Earnings understate Core Earnings[1],[2] for the trailing-twelve-months (TTM) ended calendar 1Q22. In the TTMs ended 1Q21 and 2021, 131 and 155 companies understated their earnings, respectively.
When Street Earnings understate Core Earnings, they do so by an average of -27% per company, per Figure 1. Street Earnings understate Core Earnings by >10% for ~9% of S&P 500 companies
Figure 1: Street Earnings Understated by -28% on Average in TTM Through 1Q22[3]

Sources: New Constructs, LLC and company filings.
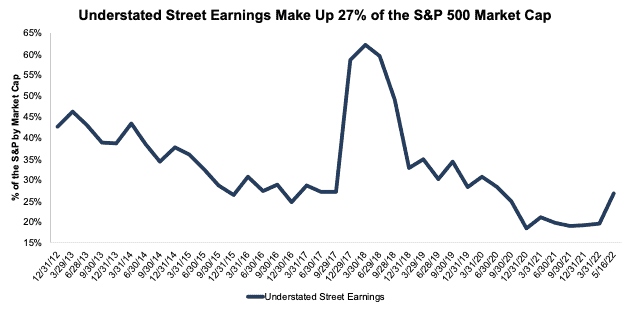
The 152 companies with understated Street Earnings represent 27% of the market cap of the S&P 500 as of 5/16/22, which is up from 20% through 2021, measured with TTM data in each quarter.
The increase from the prior TTM period is driven largely by Microsoft (MSFT) and NVIDIA Corporation’s (NVDA) Street Earnings falling from overstated through 2021 to understated through 1Q22. Combined, these two firms make up 7% of the S&P 500 market cap through 5/16/22.
Figure 2: Understated Street Earnings as % of Market Cap: 2012 through 5/16/22
Sources: New Constructs, LLC and company filings.
The Five Most Understated Earnings in the S&P 500
Companies that understate earnings are rarer than in years past but you can find them - if you know where to look.
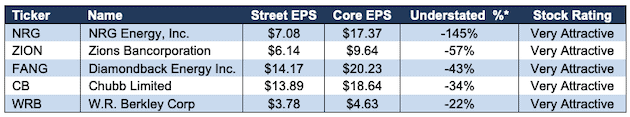
Figure 3 shows five S&P 500 stocks with Very Attractive Stock Ratings and the most understated Street Earnings (based on Street Distortion as a % of Street Earnings per share) over the TTM through 1Q22. “Street Distortion” equals the difference between Core Earnings per share and Street Earnings per share. Investors using Street Earnings miss the true profitability of these businesses.
Figure 3: S&P 500 Companies with Most Understated Street Earnings: TTM Through 1Q22
Sources: New Constructs, LLC and company filings.
*Measured as Street Distortion as a percent of Street EPS
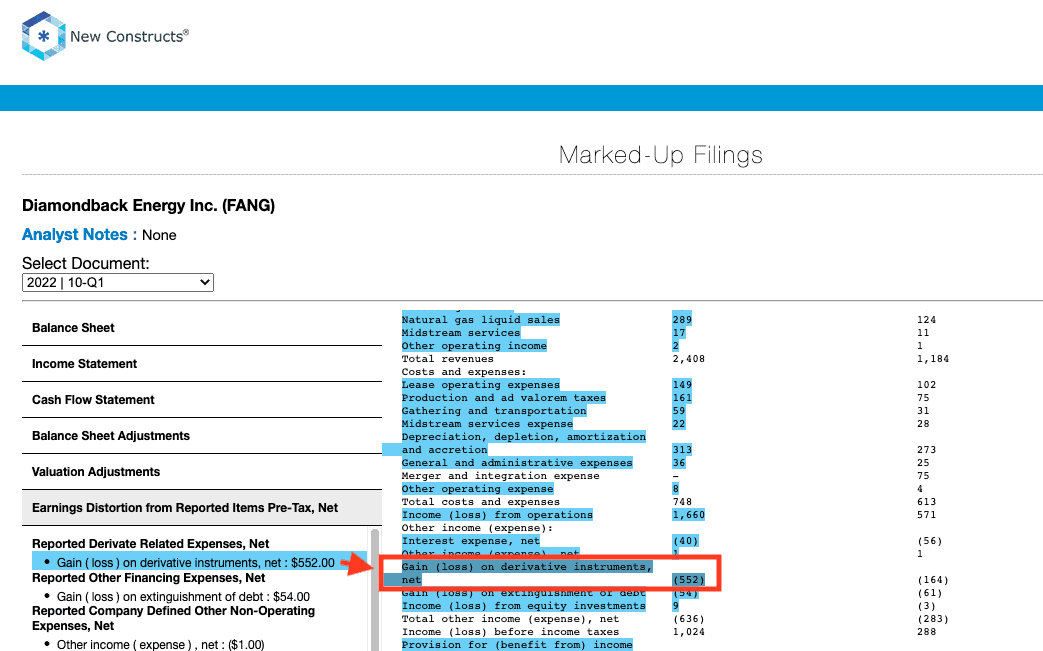
In the section below, we detail the hidden and reported unusual items that distort GAAP Earnings for Diamondback Energy (FANG). All these unusual items are removed from Core Earnings.
Diamondback Energy’s (FANG) TTM 1Q22 Street Earnings Understated by $6.06/share
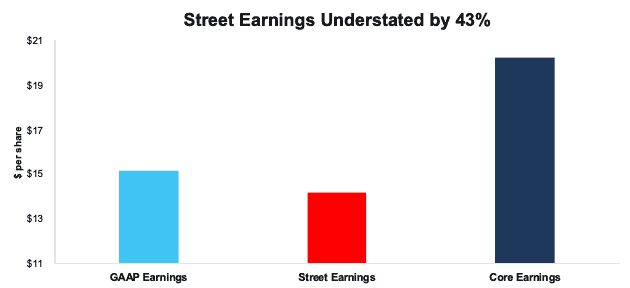
The difference between Diamondback Energy’s TTM 1Q22 Street Earnings ($14.17/share) and Core Earnings ($20.23/share) is $6.06/share, per Figure 4. We call that difference “Street Distortion,” which equals 43% of Street Earnings.
Diamondback Energy’s TTM 1Q22 GAAP Earnings ($15.16/share) understate Core Earnings by $5.07/share.
In a somewhat unusual situation, Diamondback Energy’s Street Earnings are even more distorted by unusual items than GAAP Earnings.
This example shows how Street Earnings suffer from many of the same shortcomings as GAAP measures of earnings. Our proprietary process for gathering and adjusting financial filings overcomes these shortcomings.
Figure 4: Comparing Diamondback Energy’s GAAP, Street, and Core Earnings: TTM Through 1Q22
Sources: New Constructs, LLC and company filings.
Below, we detail the differences between Core Earnings and GAAP Earnings so readers can audit our research. We would be happy to reconcile our Core Earnings with Street Earnings but cannot because we do not have the details on how analysts calculate their Street Earnings.
Diamondback Energy’s Earnings Distortion Score is Strong Beat and its Stock Rating is Very Attractive, in part due to its top-quintile return on invested capital (ROIC) and price-to-economic book value (PEBV) ratio of 0.5. Diamondback Energy has an economic book value (EBV), or no growth value, of $264/share – an 86% upside from the current price.
Figure 5 details the differences between Diamondback Energy’s Core Earnings and GAAP Earnings.
Figure 5: Diamondback Energy’s GAAP Earnings to Core Earnings Reconciliation: TTM Through 1Q22

Sources: New Constructs, LLC and company filings.
More details:
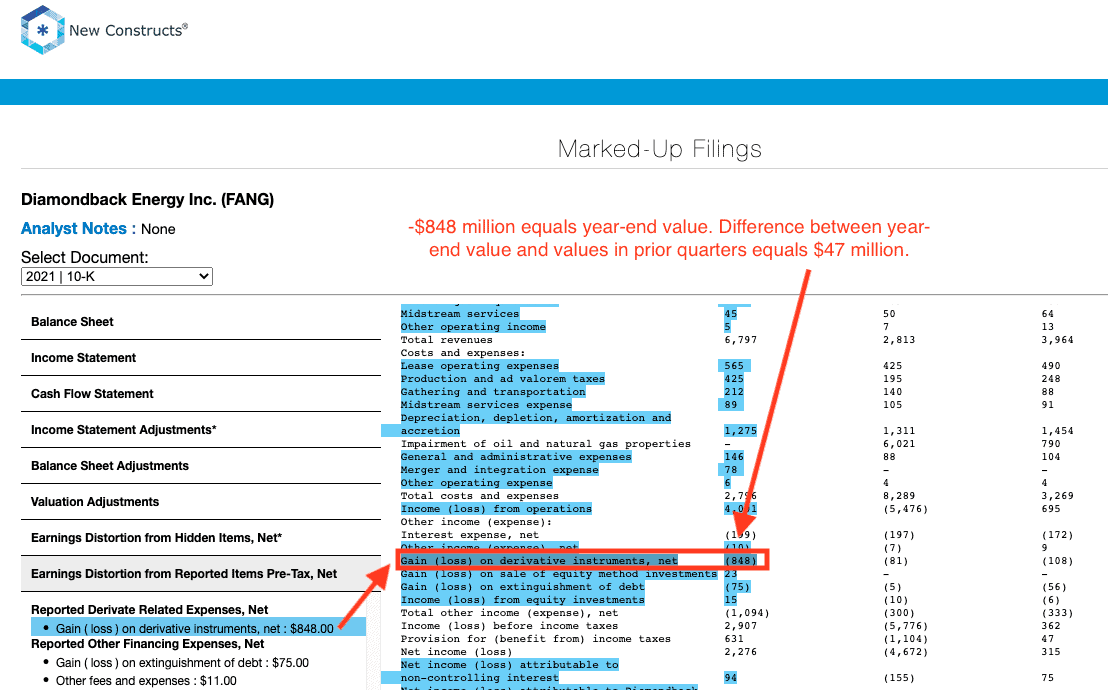
Total Earnings Distortion of -$5.07/share, which equals -$916 million, is comprised of the following:
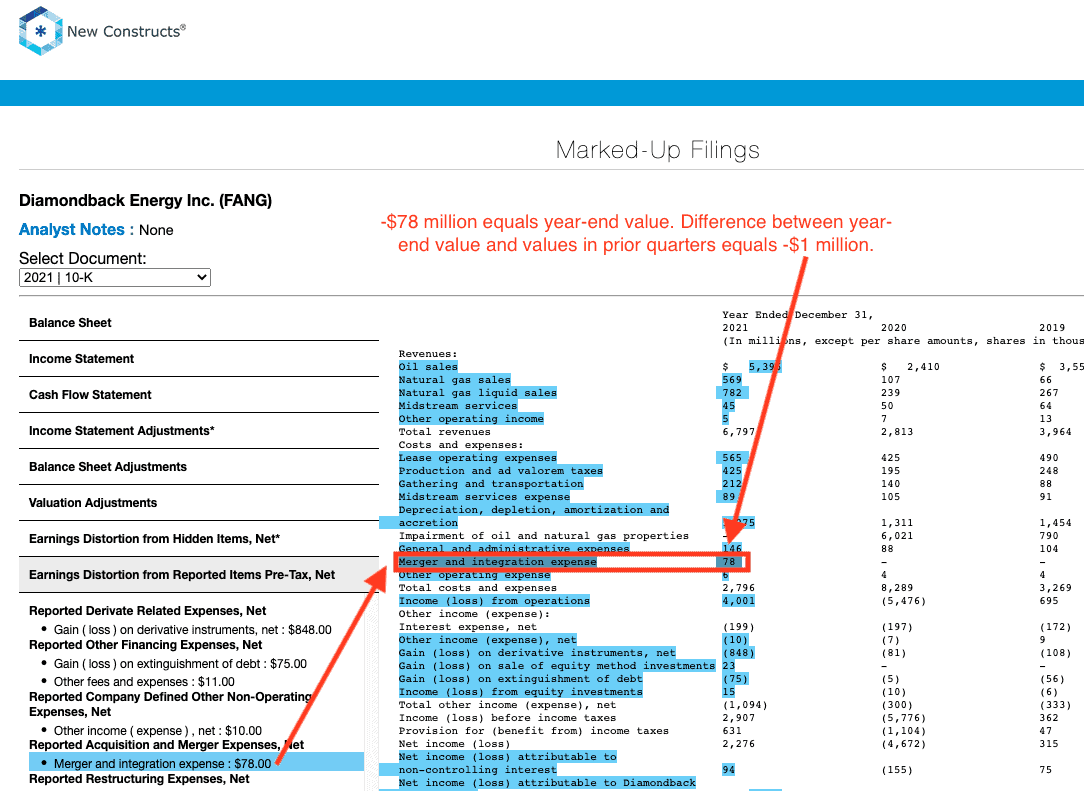
Reported Unusual Expenses Pre-Tax, Net = -$7.20/per share, which equals -$1.3 billion and is comprised of
- -$1.2 billion loss on derivative instruments in the TTM period based on
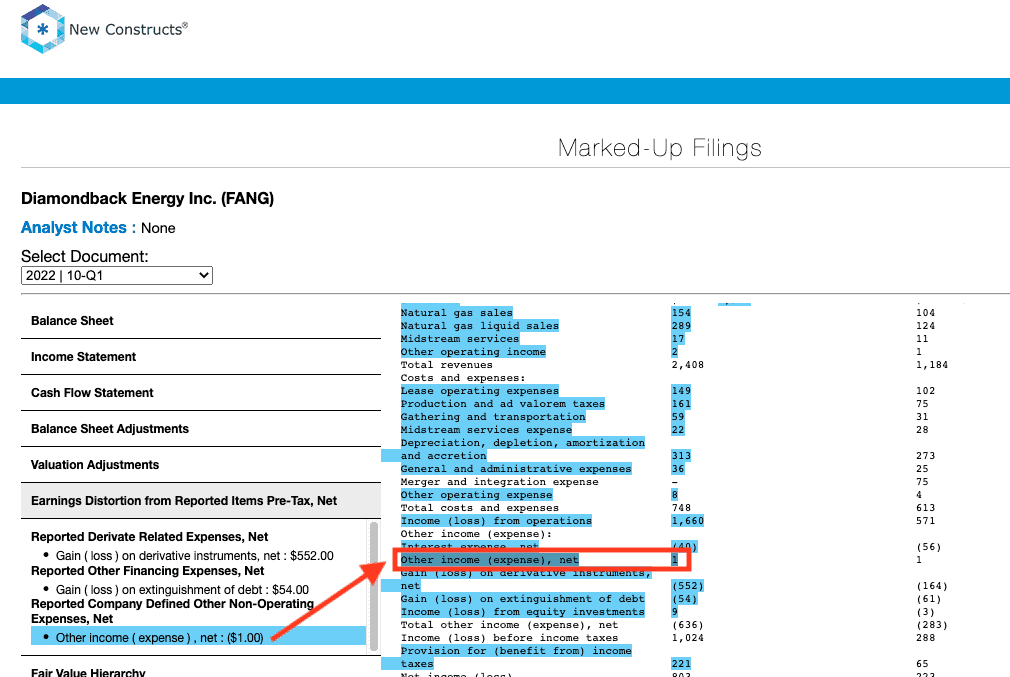
- -$552 million loss in 1Q22
- $47 million gain in 4Q21
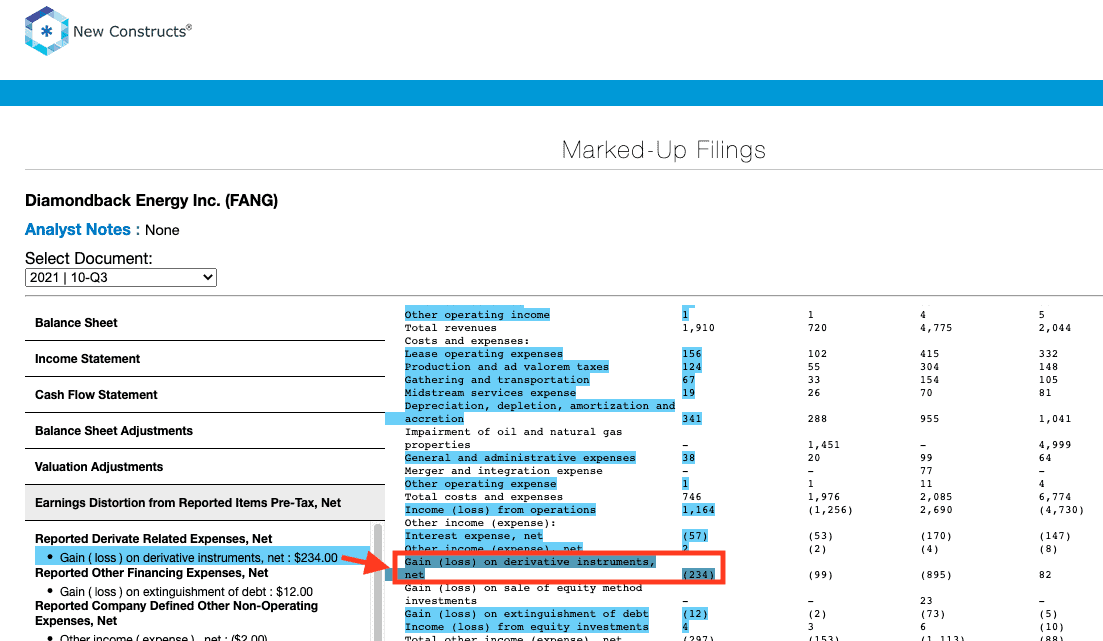
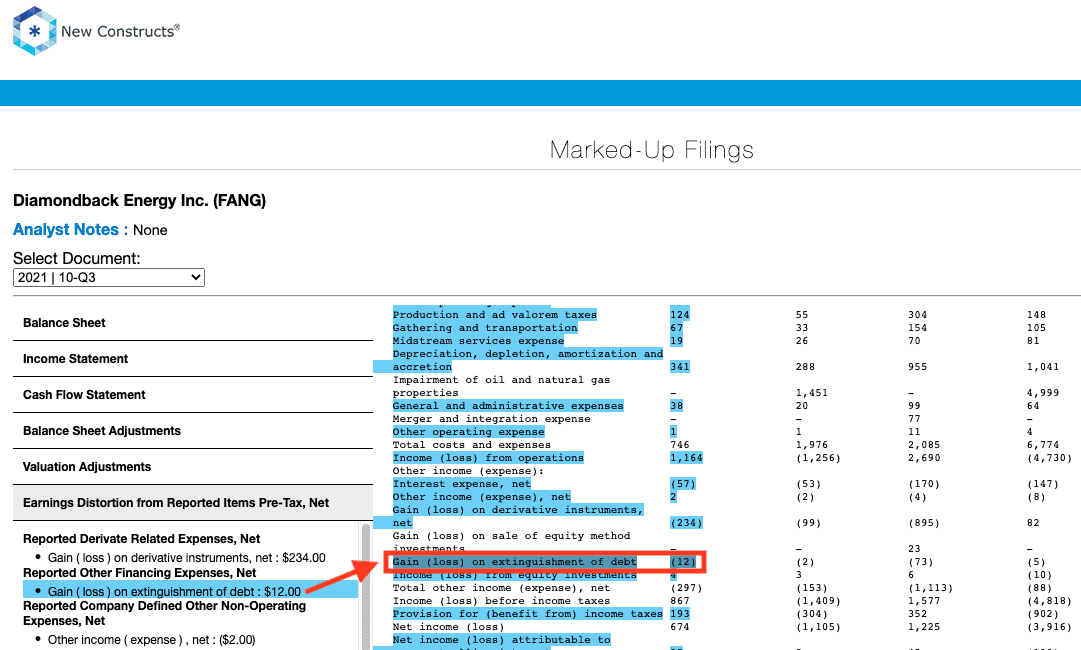
- -$234 million loss in 3Q21
- -$497 million loss in 2Q21
- -$79 million loss in reported other financing expenses in the TTM period based on
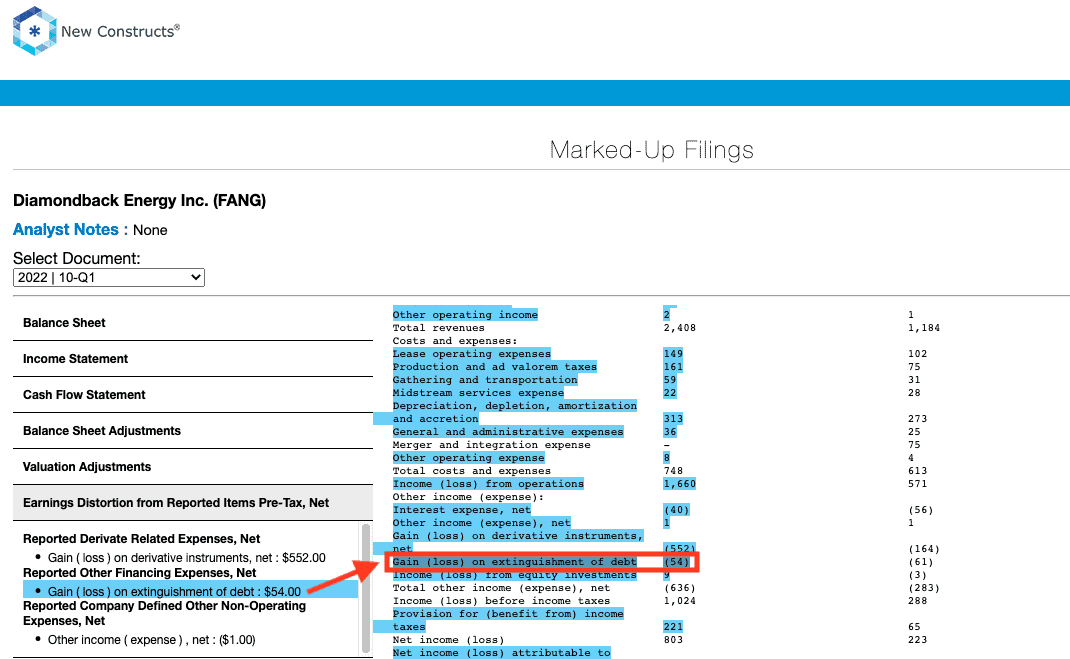
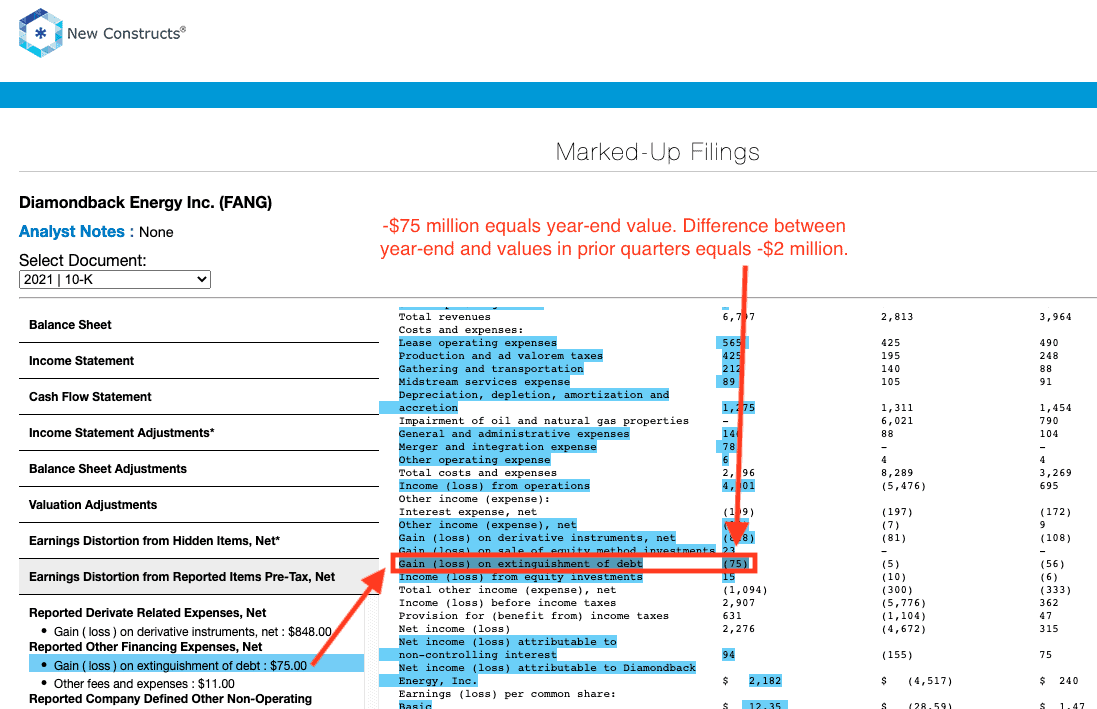
- -$54 million loss on extinguishment of debt in 1Q22
- -$2 million loss on extinguishment of debt in 4Q21
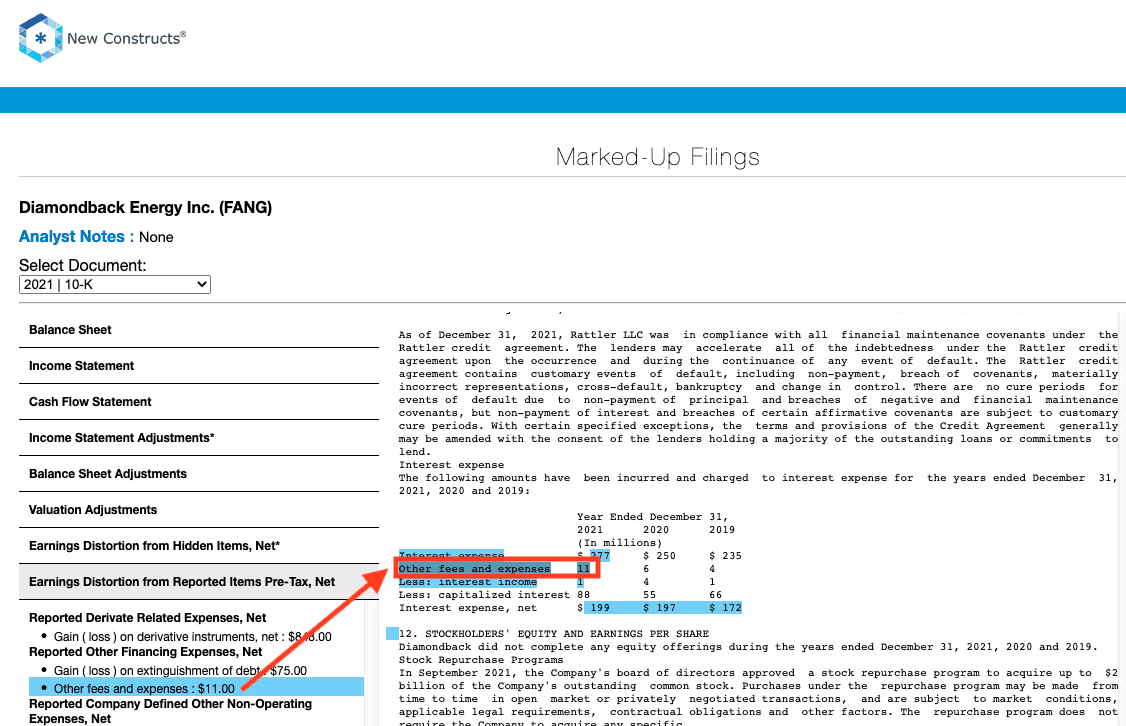
- -$11 million in other fees and expenses in 4Q21
- -$12 million loss on extinguishment of debt in 3Q21
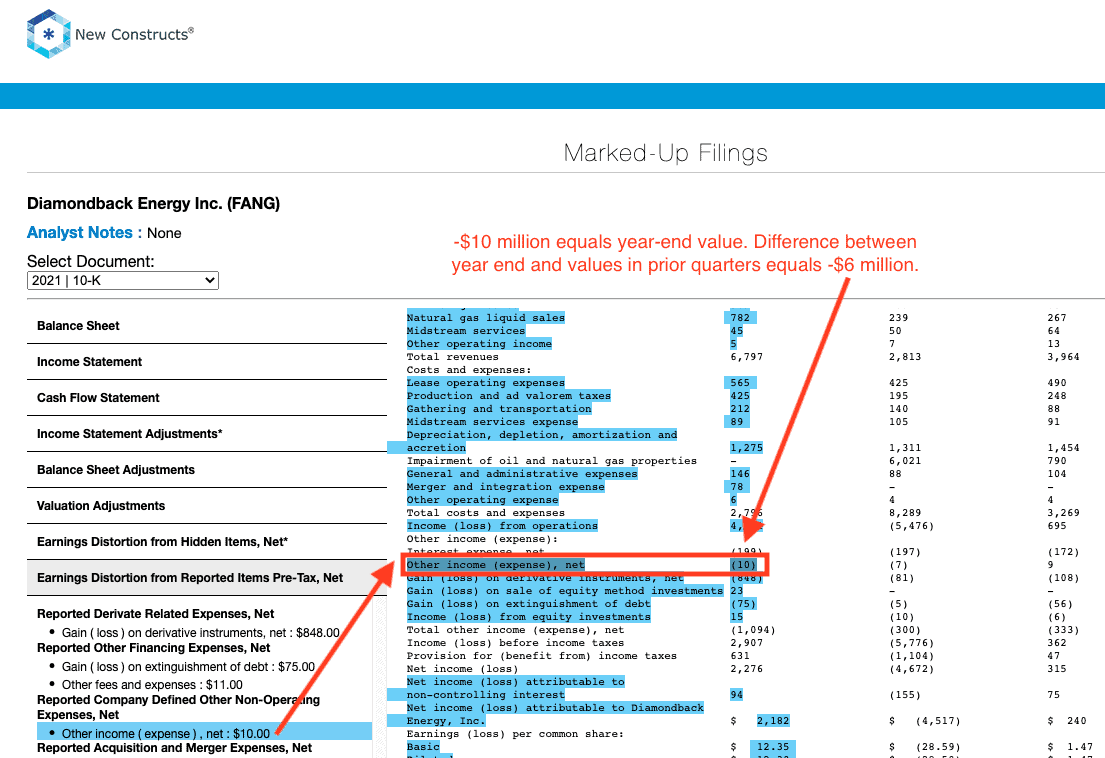
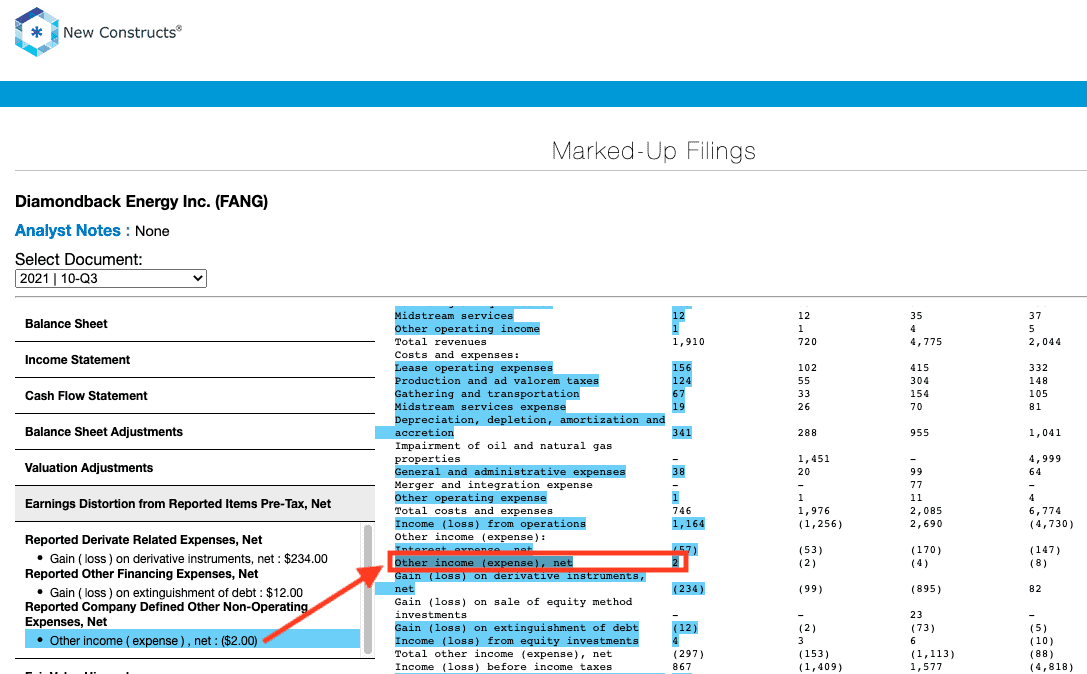
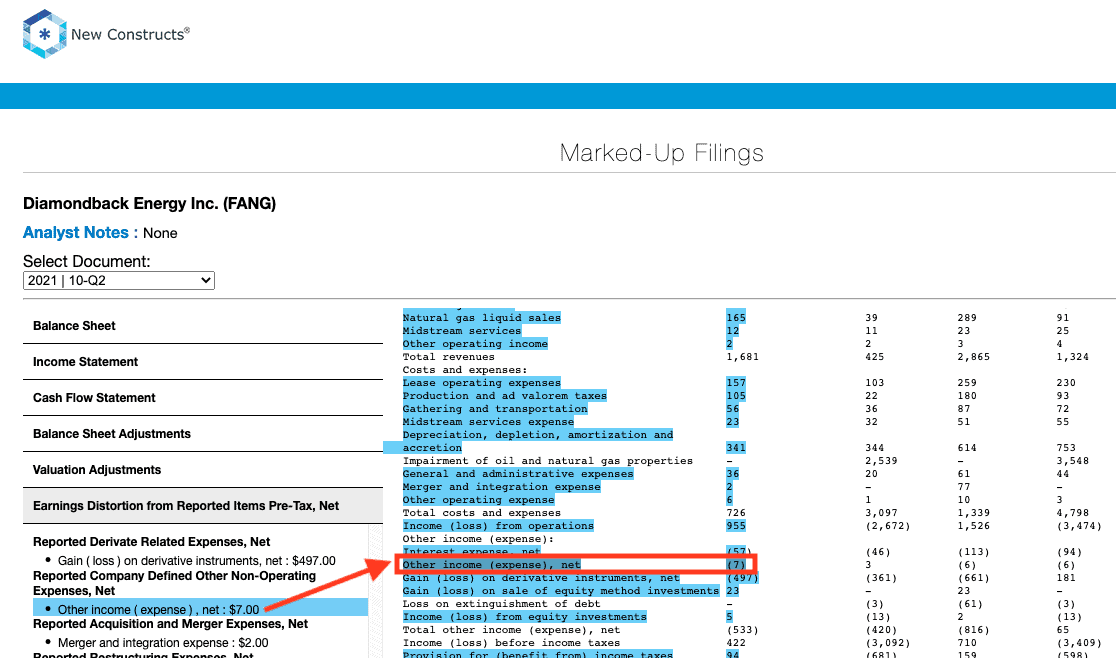
- -$10 million in other expense in the TTM period based on
- $1 million income in 1Q22
- -$6 million expense in 4Q21
- $2 million income in 3Q21
- -$7 million expense in 2Q21
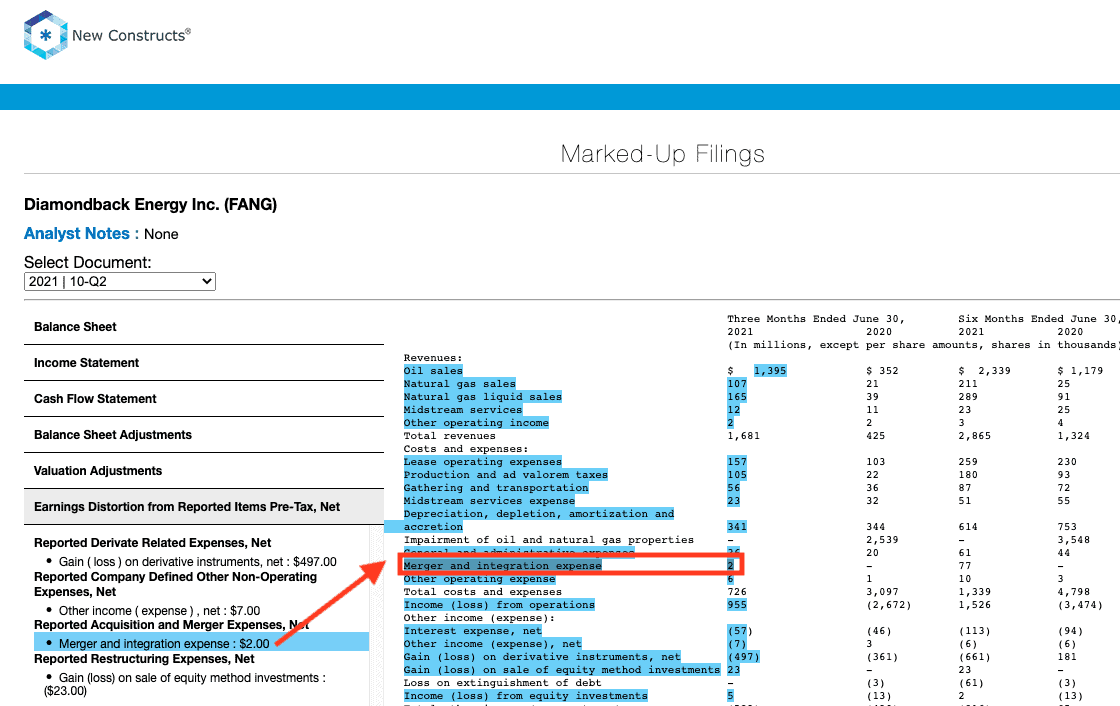
- -$3 million merger and integration expense in the TTM period based on
- -$1 million in 4Q21
- -$2 million in 2Q21
- Reversal of a -$3 million impairment of midstream assets that was disclosed in a prior 10-Q but no longer disclosed in the 2021 10-K
- $23 million gain on sale of equity method investments in 2Q21
Hidden Unusual Expenses, Net = -$0.05/per share, which equals -$9.8 million and is comprised of
- -$10 million in the TTM period based on -$13 million in revisions in estimated liabilities in the 2021 10-K – Page F-25 (page 100 overall)
Tax Distortion = $2.19/per share, which equals $396 million
The similarities between Street Earnings and GAAP Earnings for Diamondback indicates that Street Earnings miss many of the unusual items in GAAP Earnings, and the $6.06/share Street Distortion highlights that Core Earnings include a more comprehensive set of unusual items when calculating Diamondback Energy’s true profitability.
This article originally published on May 27, 2022.
Disclosure: David Trainer, Kyle Guske II, and Matt Shuler receive no compensation to write about any specific stock, style, or theme.
Follow us on Twitter, Facebook, LinkedIn, and StockTwits for real-time alerts on all our research.
[1] The Journal of Financial Economics features the superiority of our Core Earnings in Core Earnings: New Data & Evidence.
[2] Our Core Earnings research is based on the latest audited financial data, which is the calendar 1Q22 10-Q in most cases. Price data as of 5/16/22.
[3] Average understated % is calculated as Street Distortion, which is the difference between Street Earnings and Core Earnings.