The December version of our Most Attractive Stocks report is now available. Note that Barron’s recently recognized our Most Attractive Stocks portfolio as #1 over the prior 12 months amongst
The December version of our Most Attractive Stocks and Most Dangerous Stocks reports are now available for purchase. Note that Barron's recently recognized our Most Attractive Stocks portfolio as #1 over the prior 12 months amongst the best of the Wall Street research firms.
HIDDEN GEMS:
1. About $29 million in non-operating expenses (after-tax) cause reported earnings to be understated.
2. Our dis¬counted cash flow analy¬sis shows that TRV’s cur¬rent val¬u¬a¬tion (stock price of $55.49) implies that the company’s profits will decline by 30% and never grow again.
3. The company grew its economic earn¬ings by $827mm during its last fiscal year.
Today we initiated coverage of ETFs for all major sectors and Indices. Free samples of the initiation reports are here. These reports deliver strategic insights into entire sectors and markets.
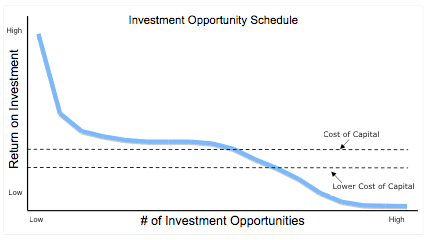
Maintaining artificially low interest rates or excessive money supply does permanent damage to economies in the medium and long-term because it delays creative destruction, the process of replacing low-return investments with higher-return investments. To help illustrate this point, I present the “Investment Opportunity Schedule” in Exhibit 1
HIDDEN GEMS:
1. About $250 million in non-operating expenses (after-tax) cause reported earnings to be understated during the last fiscal year.
2. Our discounted cash flow analysis shows that CL’s current valuation (stock price of $77.52) implies that the company’s profits will decline by 7% and never grow again.
3. The company grew its economic earnings by $229mm (14% increase) during its last fiscal year.
RED FLAGS:
1. Misleading Earnings: RAX reported a $30mm increase in GAAP earnings while our model shows economic earnings declined by $13mm (a difference of $43mm or 7% of revenue).
2. Very Dangerous Valuation: Stock price of $25.636 implies RAX must grow its NOPAT at 25% compounded annually for 17 years. A 17-year Growth Appreciation Period with a 25% compounding growth rate is quite a high standard to beat, as per my post on How To Make Money Picking Stocks.
3. Outstanding Stock Option Liability of $205mm or 6.5% of current market value
MSFT released better than expected earnings and is up 8.3% since it was named the Stock Pick of the Week on October 28, 2010. Overt the same time period, the S&P 500 is up only 3.6%.
HIDDEN GEMS:
1. Our discounted cash flow analysis shows that BMY’s current valuation (stock price of $27.16) implies that the company’s profits will decline by 35% and never grow again.
2. The company grew its economic earnings by $307.5mm (12% increase) during its last fiscal year.
3. The company has $9,507mm in Excess Cash, which we remove from our Invested Capital calculation. $9,507mm million is more than 20% of BMY’s market cap.
RED FLAGS:
Misleading Earnings: CBG reported a $1,045mm increase in GAAP earnings while our model shows economic earnings declined by $358mm.
Very Dangerous Valuation: Stock price of $19.06 implies CBG must grow its NOPAT at 20% compounded annually for 15 years. Has any company ever done that, much less a commercial real estate company?
HIDDEN GEMS:
1. Our discounted cash flow analysis shows that WNI’s current valuation (stock price of $7.89) implies that the company’s profits will decline by 25% and never grow again.
2. The company grew its economic earnings more than its reported earnings. Economic earnings rose by $9.1mm (506% increase) while Net Income rose by only $8.1mm (79% increase) during its last fiscal year.
3. The company has $42mm in Excess Cash, which we remove from our Invested Capital calculation. $42 million is 20% of WNI’s market cap.
Rite Aid Corp (RAD) gets a Dangerous Rating because of these RED FLAGs:
1. Very Expensive valuation: current stock price implies the company will grow revenues and NOPAT at 6% compounded annually for the next 15 years while also more than doubling ROIC from 6.1% to 13.7% within the same time frame.
2. Off Balance-Sheet debt: of $5,502mm or 93% of "Reported" Net Assets
3. Asset-write-offs: $3,417mm or 58% of "Reported" Net Assets
Main RED FLAG:
Very Dangerous Valuation: The current stock price of $36.89 implies VMC must grow its NOPAT at 12% compounded annually for 40 years.
The market has set expectations very high for this stock - leaving little upside potential and lots of downside risk, especially when considering the company's Misleading Earnings.
We reiterate our pick for last week's Stock Pick of the Week: Buy Microsoft Corp (MSFT) — Very Attractive Rating. We consider the recent downgrade from Goldman an investment-banking driven head fake. Because MSFT is not a good investment banking client (very little merger or stock offering activity), investment banks have little to lose by downgrading or putting a sell rating on the this stock.
Drugstore.com (DSCM) gets a Dangerous Rating because of these RED FLAGs:
1. Very Expensive valuation: current stock price implies the company will grow revenues at 20% compounded annually for the next 15 years while also improving ROIC from –2.3% to 10.9% within the same time frame.
2. Off Balance-Sheet debt: of $15mm or 15% of Net Assets
3. Asset-write-offs: $210mm or 206% of Net Assets
HIDDEN GEMS:
1. Our discounted cash flow analysis shows that MSFT’s current valuation (stock price of $24.73) implies that the company’s profits will decline by 20% and never grow again.
2. The company has $43,292mm in Excess Cash (over 20% of the market cap), which we remove from our Invested Capital calculation and which helps drive a whopping 61.6% ROIC.
3. Our economic earnings models shows profits are growing, not declining, which makes the Risk/Reward for MSFT Very Attractive.
CBS’s get our Very Dangerous Rating. There is lots of downside risk given the Misleading Earnings and there is little upside reward given the already-rich expectations embedded in the stock price.
RED FLAGS:
1. Misleading Earnings: CBS reported a $11,899mm increase in GAAP earnings while our model shows economic earnings declined by $548mm.
2. Underfunded Pensions of $2,239mm (20% of market value)
3. Asset-write-offs of $10,559mm in asset write-offs (50% of Net Assets and nearly 100% of the market value)
4. High Valuation: market price implies CBS must grow its revenue at 10% compounded annually for 23 years and increase its ROIC from 2.4% to 6% over the same time frame.
icad (ICAD) gets a Dangerous Rating because of these RED FLAGs:
1. Very Expensive valuation: current stock price implies the company will grow revenues at 20% compounded annually for the next 10 years while also improving ROIC from -3.7% to 1.5% within the same time frame.
2. Option Liabilities: of $2.1mm or 3% of the current market value
3. Asset-write-offs: $4.4mm or 7% of Net Assets
HIDDEN GEM: Our detailed discounted cash flow analysis shows that STX’s current valuation (stock price of $11.24) implies that the company’s profits will decline by 80% and never grow again. Our economic earnings model shows profits are growing, not declining, which makes the Risk/Reward for STX Very Attractive.
The Risk/Reward of investing in Capital One’s stock looks Very Dangerous to me. There is lots of downside risk given the Misleading Earnings and there is little upside reward given the already-rich expectations embedded in the stock price.
RED FLAGS:
1. Misleading Earnings: COF reported a $399mm increase in GAAP earnings while our model shows economic earnings declined by $1,783mm.
2. The company’s ROIC is in the Bottom Quintile of all the companies we cover.
3. Stock price of $40.69 implies COF must grow its NOPAT at 15% compounded annually for 15 years.