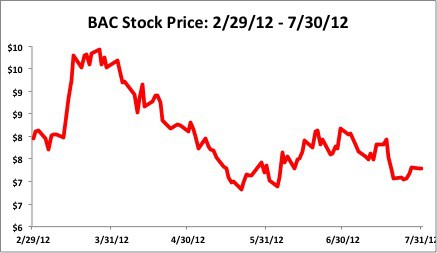
For the first time in many months, both Citigroup (C) and Bank Of America (BAC) are not on our Most Dangerous Stocks list as of the release of the August report.
Always flattered when a journalist, especially one as famous and respected at Mr. Taibbi, references my work. His article "Bank of America In Trouble?" incorporated the meat of my "Raising Fees Is A Desperate Measure: Sell BAC" article.
It is only a matter of time before oil and gas stocks stop moving with the price of oil and start reflecting their underlying economics.
When this happens, Baker Hughes (BHI – “very dangerous” rating) will be among the stocks that fall the hardest.
Is VHC the next Google? The market’s current valuation seems to suggest it is that and much more.
Very few times in the last 15 years have I found a stock as expensive as VHC. The only comparable situation that comes to mind is Google (GOOG) at its IPO.
Principal Financial Group, Inc. (PFG) reported accounting earnings in 2010 that are misleading compared to the true economic earnings of the business. PFG’s 2010 reported earnings are artificially boosted by a reduced loan loss expense, which is funded by a draw down of the company’s loss reserves.
Over the past 10 years, ARBA appears as quite a success story and one of the few ‘internet bubble’ companies to survive and reach profitability, on a GAAP accounting basis at least. Looking beyond the reported accounting results, however, reveals that ARBA is not quite as profitable a company as it seems, and its valuation has out-grown its profits by a wide margin – the required combination of factors for making February’s list of most dangerous stocks.
Misleading earnings: NYX reported a $957mm increase in GAAP earnings while our model shows economic earnings declined by $641mm (a difference of $1,599mm or 34% of 2009 revenues during the last fiscal year. The majority of this disconnect comes from asset-write offs of $1,249mm, which equals 12% of reported net assets.
Red flags:
1. Misleading earnings: BJRI reported a $3mm increase in GAAP earnings while our model shows economic earnings declined by $2mm (a difference of $5mm or nearly 40% of reported net income) during the last fiscal year.
2. Very dangerous valuation: stock price of $34 implies BJRI must grow its NOPAT at over 20% compounded annually for 15 years. A 15-year growth appreciation period with a 20%+ compounding growth rate sets expectations for future cash flow performance quite high. Historical growth rates are much lower.
3. Free cash flow was -$83mm or -11% of the company’s enterprise value last year.
4. Off-balance sheet debt of $265mm: 79% of net assets and 25% of market value.
5. Outstanding stock option liability of $44mm or 5% of current market value.
Retail and Financials are the most common stocks on our Most Dangerous Stocks list for January. Now that the holiday shopping season is behind us, we see little incremental upside in the retail and financial sectors.
RED FLAGS:
1. Misleading earnings: DFS reported a $295mm increase in GAAP earnings while our model shows economic earnings declined by $998mm (a difference of $1,293mm or over 100% of reported net income). The majority of the overstated reported earnings comes from a one-time gain from an anti-trust settlement of $1,892mm.
2. Very dangerous valuation: stock price of $19 implies DFS must grow its NOPAT at over 10% compounded annually for 40 years. A 40-year growth appreciation period with a 10%+ compounding growth rate sets expectations for future cash flow performance quite high. Historical growth rates have never been much lower.
3. Free Cash Flow was -$2,470mm or -26% of the company’s enterprise value last year.
4. Asset write-offs of $428mm or 5% of net assets – this means that management has written off at least $0.05 of assets for every $1 on the current balance sheet. Writing off assets is the opposite of creating shareholder value as it reflects management’s inability to derive any profits for the investments it makes with shareholder funds.
5. Off-balance sheet debt of $38mm or 0.5% of net assets.
6. Outstanding stock option liability of $8mm or less than 1% of current market value.
The December version of our Most Attractive Stocks and Most Dangerous Stocks reports are now available for purchase. Note that Barron's recently recognized our Most Attractive Stocks portfolio as #1 over the prior 12 months amongst the best of the Wall Street research firms.
Red Flags:
1. Misleading earnings: JDAS reported a $14.6mm increase in GAAP earnings while our model shows economic earnings declined by $12.9mm (a difference of $27.5mm or 155% of reported net income).
2. Very dangerous valuation: stock price of $27 implies JDAS must grow its NOPAT at over 20% compounded annually for 10 years. A 10-year growth appreciation period with a 20%+ compounding growth rate sets expectations for future cash flow performance quite high.
3. Free Cash Flow was -$203mm or -15% of the company’s enterprise value last year.
4. Asset write-offs of $21mm or 3% of net assets – this means that management has written off at least $0.03 of assets for every $1 on the current balance sheet. Writing off assets is the opposite of creating shareholder value as it reflects management’s inability to derive any profits for the investments it makes with shareholder funds.
5. Off-balance sheet debt of $40mm or 6% of net assets.
6. Outstanding stock option liability of $13mm or 1% of current market value.
RED FLAGS:
1. Misleading Earnings: AKAM reported a $1mm increase in GAAP earnings while our model shows economic earnings declined by $10mm (a difference of $11mm or 7% of reported net income).
2. Very Dangerous Valuation: Stock price of $47 implies AKAM must grow its NOPAT at over 20% com¬pounded annu¬ally for 15 years. A 15-year growth appreciation period with a 20%+ compounding growth rate sets expectations for future cash flow performance quite high.
3. Asset write-offs of $2,000mm or 102% of Net Assets – this means that management has written off at least $1 of assets for every $1 on the current balance sheet. Writing off assets is the opposite of creating shareholder value as it reflects management’s inability to derive any profits for the investments it makes with shareholder funds.
4. Off-balance sheet debt of $128mm or 7% of Net Assets.
5. Outstanding Stock Option Liability of $212mm or 3% of current market value.
RED FLAGS:
Misleading Earnings: CBG reported a $1,045mm increase in GAAP earnings while our model shows economic earnings declined by $358mm.
Very Dangerous Valuation: Stock price of $19.06 implies CBG must grow its NOPAT at 20% compounded annually for 15 years. Has any company ever done that, much less a commercial real estate company?
Main RED FLAG:
Very Dangerous Valuation: The current stock price of $36.89 implies VMC must grow its NOPAT at 12% compounded annually for 40 years.
The market has set expectations very high for this stock - leaving little upside potential and lots of downside risk, especially when considering the company's Misleading Earnings.
CBS’s get our Very Dangerous Rating. There is lots of downside risk given the Misleading Earnings and there is little upside reward given the already-rich expectations embedded in the stock price.
RED FLAGS:
1. Misleading Earnings: CBS reported a $11,899mm increase in GAAP earnings while our model shows economic earnings declined by $548mm.
2. Underfunded Pensions of $2,239mm (20% of market value)
3. Asset-write-offs of $10,559mm in asset write-offs (50% of Net Assets and nearly 100% of the market value)
4. High Valuation: market price implies CBS must grow its revenue at 10% compounded annually for 23 years and increase its ROIC from 2.4% to 6% over the same time frame.