
AI spending is taking no prisoners and is crushing the cash flows of the biggest names in the Technology sector.
Mag 7 Is Now the Mag 5
If you’ve read our latest research, you know that we think at least two tech giants are likely to drop out of the AI race and give up their leadership status. Nevertheless, the five that remain have wide shoulders and continue to disproportionately contribute to the sector’s financial performance.
In this report, we’ll show how Apple (AAPL), Alphabet (GOOGL), Microsoft (MSFT), Meta (META), and NVIDIA (NVDA) are the last tech giants standing and are carrying the overall tech sector’s fundamentals on their broad shoulders. So, the Mag 7 is now the Mag 5. Given our findings in our recent AI Winners and Losers reports, the Mag 5 might be the Mag 3 in the not-too-distant future.
Historically, Tech Is in a Class of Its Own
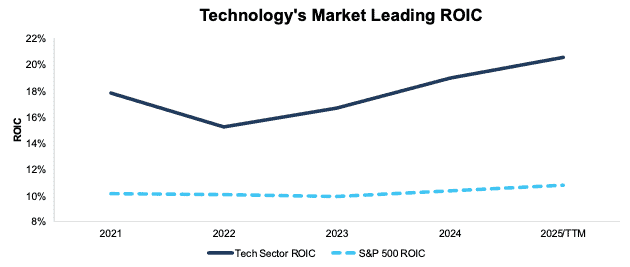
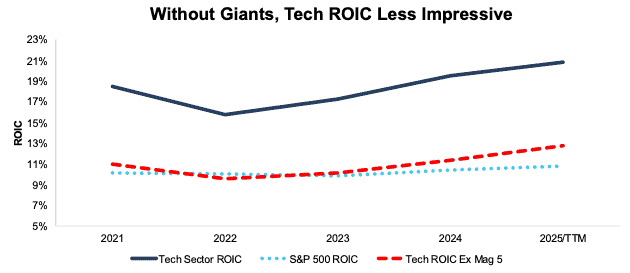
It’s no secret that over the last several years, the Technology sector has been, by far, the most profitable sector. Over the trailing-twelve-months (TTM), the overall Technology sector generates a return on invested capital (ROIC) of 21%, which is nearly double the ROIC of the S&P 500 at 11%. The gap between the two is rising over the past few years as well. See Figure 1.
When we look at a market-cap weighted average, which accounts for the size of a company relative to the overall sector or S&P 500, the discrepancy is eye-opening.
Over the TTM, the market-cap weighted average ROIC for the Technology sector is 57%, compared to 35% for the S&P 500.
Figure 1: Aggregate ROIC: Tech Vs. S&P 500: 2021-2025/TTM
Sources: New Constructs, LLC and company filings
Calculated by summing the individual S&P 500 and Technology sector company values for NOPAT and average invested capital to calculate ROIC. We call this approach the “Aggregate” methodology. The Aggregate methodology provides a straightforward look at the entire sector, regardless of market cap or index weighting.
In addition to the highest ROIC, the Technology sector also boasts, relative to the other ten sectors:
- the most free cash flow,
- the most net operating profit after-tax (NOPAT), and
- the highest NOPAT margin.
The takeaway was clear: if you want highly efficient, highly profitable business, buy tech.
But, a look beneath the surface reveals this strength is built on the backs of just five companies.
Remove 1% of Tech Companies and The Strength Collapses
Apple, Alphabet, Microsoft, Meta, and NVIDIA continue to generate billions in profits and operate with some of the highest NOPAT margins in the market.
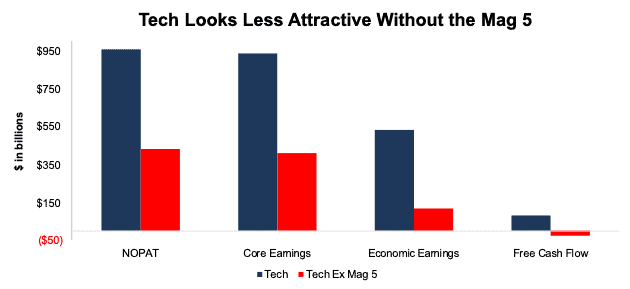
To illustrate this point, if you remove these five, or 1% of the companies from the sector calculations, top and bottom-line metrics fall precipitously:
- Revenue: -33%
- NOPAT: -55%
- Core Earnings: -56%
- Economic Earnings: -77%
- FCF: -127%
See Figure 2.
Figure 2: Technology Sector Metrics: With and Without Tech Giants: 2025/TTM
Sources: New Constructs, LLC and company filings
Tech Sector FCF Is Negative without the Mag 5
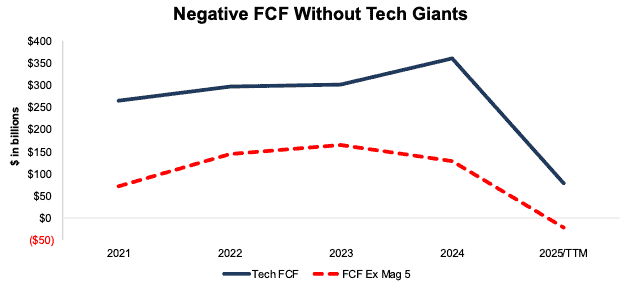
Of the metrics above, the percentage decline in FCF is the most alarming because without the Mag Five tech giants, the Technology sector’s FCF is negative (-$22 billion over the TTM).
The Technology sector’s FCF without the five tech giants would rank ninth amongst the 11 sectors, ahead of only Consumer Cyclicals and Utilities.
Figure 3: Technology FCF: With and Without Mag 5 Tech Giants: 2021-2025/TTM
Sources: New Constructs, LLC and company filings
Standing Out for the Wrong Reason: Biggest Drags on Free Cash Flow
Figure 4 shows the companies with the worst FCF over the TTM in the Technology sector, which include Oracle (ORCL), Synopsys (SNPS), Strategy (MSTR), Hewlett Packard (HPE), and CoreWeave (CRWV). Notably, three of these companies (Oracle, Synopsys, and CoreWeave) are heavily invested in AI.
More on why these cash burners stand out for all the wrong reasons below.
Figure 4: Technology’s Largest Cash Burners: TTM

Sources: New Constructs, LLC and company filings
FCF Yield Decline Accelerates
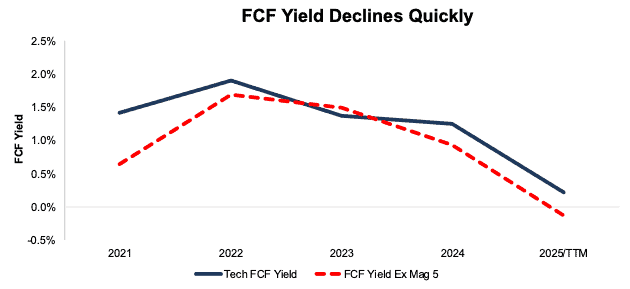
The Technology sector’s FCF yield has declined over the past few years, but without the billions in cash flow from the Mag 5 to boost the entire sector, the decline looks even worse.
The overall Technology sector’s FCF yield declined from 1.9% in 2022 to 0.5% over the TTM. However, the Technology sector without the Mag 5 shows FCF yield declined from 1.7% to -0.1% over the same time.
Figure 5: Aggregate FCF Yield: With and Without Mag 5 Tech Giants: 2021-2025/TTM
Sources: New Constructs, LLC and company filings
Calculated by summing the individual Technology sector company values for free cash flow and enterprise value to calculate FCF yield. We call this approach the “Aggregate” methodology. The Aggregate methodology provides a straightforward look at the entire sector, regardless of market cap.
Margins and ROIC Drop to Average
Removing the Mag 5 doesn’t just impact FCF and FCF yield. Profitability metrics across the board fall significantly. For example, over the TTM, the Technology sector’s
- NOPAT margin falls from 21% to 14%,
- Invested capital turns fall from 1.0 to 0.9, and
- ROIC falls from 21% to 13%.
Without the Mag 5, the Technology sector’s margin falls below the Real Estate, Utilities, and Telecom Services sector. Figure 6 shows the drop in ROIC and, specifically, how without the Mag 5, the Technology sector’s profitability is average, rather than exceptional.
Figure 6: Aggregate ROIC: With and Without Mag 5 Tech Giants: 2021-2025/TTM
Sources: New Constructs, LLC and company filings
Calculated by summing the individual Technology sector company values for NOPAT and average invested capital to calculate ROIC. We call this approach the “Aggregate” methodology. The Aggregate methodology provides a straightforward look at the entire sector, regardless of market cap.
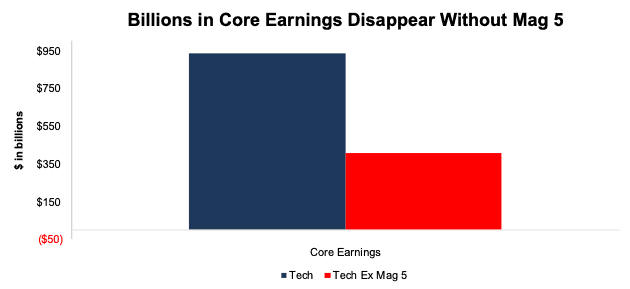
Core Earnings Take a Dive
Without the Mag 5, the Technology sector’s Core Earnings drop 56%. See Figure 7.
Figure 7: Technology Sector Core Earnings: With and Without Mag 5: 2025/TTM
Sources: New Constructs, LLC and company filings
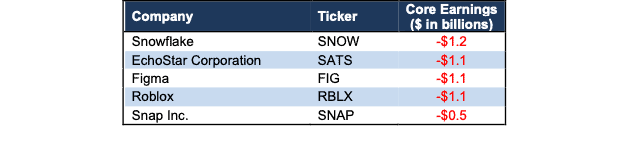
Figure 8 shows the companies with the worst Core Earnings in the sector: Snowflake (SNOW), EchoStar Corporation (SATS), Figma (FIG), Roblox (RBLX), and Snap (SNAP).
Figure 8: Technology Sector’s Most Negative Core Earnings: TTM
Sources: New Constructs, LLC and company filings
Tech Is Not a Safe Sector: Avoid the Landmines
Making matters worse, each of the stocks in Figure 8, as well as those in Figure 4, have very unattractive and highly risky valuations.
Specifically, eight of the ten stocks have negative economic book values (EBV) and market-implied growth appreciation periods (GAPs) of more than 100 years (based on our Robo-Analyst’s Default Scenario). Oracle has a negative EBV, but its market-implied GAP is lower at 28 years, which still earns an Unattractive rating. Synopsys has a positive EBV, but its market-implied GAP is also more than 100 years.
They’re not alone. Over the TTM, there are 250 Technology stocks with negative Core Earnings and 388 stocks with negative Economic Earnings.
As shown above, the Technology sector’s superior profitability is far less diversified than investors likely realize. The Mag 5 contribute a highly disproportionate share of revenue, profits, and free cash flow.
Blindly allocating to the Technology sector is increasingly risky, especially as the Mag 5 enter a period that could see cash flows and ROICs decline even further (get the details). Meanwhile, hundreds of unprofitable Technology stocks trade at valuations that can’t be justified by the fundamentals of the underlying businesses.
In the current market, passive exposure to the Technology sector is not diversified exposure to elite profitability, as many believe. Despite the flashy narratives across the sector, if you’re not buying the cream of the crop, your portfolio could be in big trouble. There are plenty of good stocks elsewhere.
This article was originally published on March 2, 2026.
Disclosure: David Trainer and Kyle Guske II receive no compensation to write about any specific stock, style, or theme.
Questions on this report or others? Join our online community and connect with us directly.