Check out this week’s Danger Zone interview with Chuck Jaffe of Money Life.
Quarterly earnings season may be winding down, but the real earnings season – annual 10-K filing season – is ramping up. Investors ignoring filings, footnotes, and the MD&A are in the Danger Zone.
Why Footnotes Matter – Analysts & GAAP Earnings Are Off by ~20% On Average
Since 2005, we’ve reported how traditional earnings measures are unreliable due to accounting loopholes that allow companies to manage earnings.
A new paper from Harvard Business School & MIT Sloan proves GAAP and Wall Street earnings are off by nearly 20% on average[1]. The paper is titled Core Earnings: New Data and Evidence and has been selected for publication in The Journal of Financial Economics.
The only way to overcome the flaws in GAAP net income (and other profit metrics from legacy providers) is through rigorous analysis of company filings, especially the footnotes and MD&A[2].
Below, we provide an example of a new tool for earnings management and highlight two companies with highly misleading GAAP net income.
New Loophole: Bitcoin Accounting Treatment
Bitcoin investing is the latest accounting loophole used to manage earnings.
MicroStrategy (MSTR: $928/share) provides an example of how reported GAAP net income understates true profits due to Bitcoin losses rather than any change in the firm’s core operations. In 2020, MicroStrategy recorded a $71 million impairment charge (nearly 2x the firm’s 2020 Core Earnings) related to the firm’s Bitcoin assets. More details here.
Tesla’s (TSLA: $787/share) recent purchase of Bitcoin could create a similar scenario for potential earnings management. While Tesla’s Bitcoin purchase doesn’t require any adjustment yet, without being aware of all unusual items, you’ll never know when an adjustment will materially impact a firm’s true fundamentals, and in turn, its valuation.
Going forward, we will remove any gains/losses firms realize when they sell Bitcoin from our calculations of profits, as these gains/losses represent non-operating income/losses. Without this diligence, investors could make misinformed investment decisions.
Overstated Earnings: Celanese Corp (CE)
Of the S&P 500 companies that have already filed their 10-K, Celanese Corp (CE: $131/share) has the most overstated GAAP net income, and gets our “Strong Miss” Earnings Distortion Score.
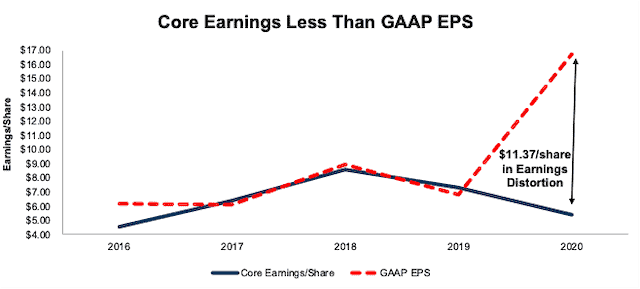
In 2020, Celanese has $1.3 billion in Earnings Distortion that overstate earnings by $11.37/share or 68% of EPS. After removing Earnings Distortion, Celanese’s 2020 Core Earnings of $5.38/share are much less than GAAP EPS of $16.75, per Figure 1. Get details on the firm’s Earnings Distortion below.
Figure 1: Celanese Corp’s Core Earnings Vs. GAAP Net Income: 2016 - 2020
Sources: New Constructs, LLC and company filings
Notable unusual gains/losses reported in Celanese’s 10-K include:
- $1.4 billion in other non-recurring income such as:
- $1.4 billion gain on sale of investments in affiliates reported on the income statement
- $6 million gain from commercial disputes bundled in Other (Charges) Gains, Net on the income statement. The breakout of Other (Charges) Gains, Net is found in the footnotes on page 105 of the firm’s 2020 10-K.
- $126 million in dividend income related to equity investments reported on the income statement
- $17 million in non-operating pension and other postretirement employee benefit income reported on the income statement
- $7 million loss on disposition of businesses and assets reported on the income statement
- $5 million in other income reported on the income statement
- $5 million in foreign exchange losses reported on the income statement
- Each of the below items are bundled in Other (Charges) Gains, Net on the income statement. The breakout of Other (Charges) Gains, Net is found in the footnotes on page 105 of the firm’s 2020 10-K
- $31 million in asset impairment charges
- $20 million restructuring charges
- $7 million plant/office closures gain
- $2 million in European Commission investigation charges
- $1 million in other income
In addition, we made a -$128 million adjustment for income tax distortion. This adjustment normalizes reported income taxes by removing the impact of unusual items.
Clearly, getting to the truth about Celanese’s profitability requires lots of work. We do that work for nearly all U.S. exchange-traded companies. CE gets our Neutral Risk/Reward rating, which is our long term rating on the stock.
Understated Earnings: Hanesbrands (HBI)
On the other hand, of the S&P 500 companies that have already filed their 10-K, Hanesbrands’ (HBI: $18/share) GAAP net income is among the most understated, and the company gets our “Strong Beat” Earnings Distortion Score.
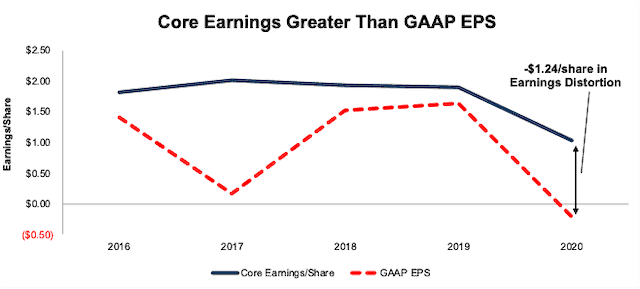
In 2020, Hanesbrands Inc. (HBI: $18/share) has -$438 million in Earnings Distortion that cause earnings to be understated by -$1.24/share or 579% of EPS. After removing Earnings Distortion, Hanesbrands’s 2020 Core Earnings of $1.03/share are much greater than GAAP EPS of -$0.21, per Figure 2. Get details on the firm’s Earnings Distortion below.
Figure 2: Hanesbrands’s Core Earnings Vs. GAAP Net Income: 2016 - 2020
Sources: New Constructs, LLC and company filings
Notable unusual gains/losses hidden and reported in Hanesbrands 10-K include:
- $630 million in asset write-downs hidden in operating earnings disclosed on Page F-9 (page 62 overall), such as:
- $585 million in inventory write-down charges
- $46 million in impairment of intangible assets and goodwill
- $101 million in non-operating expenses hidden in operating earnings disclosed on Page F55 (page 108 overall), such as
- $49 million in supply chain re-startup charges
- $24 million in supply chain actions expenses
- $18 million in other restructuring costs
- $10 million In program exit costs
- $23 million in other expenses reported on the income statement
In addition, we made a $302 million adjustment for income tax distortion to normalize reported income taxes.
Hanesbrands also earns an Attractive Risk/Reward rating given its positive economic earnings and PEBV ratio of 0.9, which is well below the Textiles & Apparel industry average of 4.4.
Just as with Celanese, getting to the truth about Hanesbrands’ profitability requires lots of work. Below, we explain the cutting-edge technology that enables us to scale our financial accounting expertise to democratize access to reliable fundamental data and research.
Technology to Provide Reliable Research at Scale
For humans, performing this level of rigor (i.e. analyzing filings & footnotes) on just a few companies is a daunting task. Applying this level of rigor to thousands of companies is downright impossible – until now.
We use our cutting-edge Robo-Analyst technology to help automate the analysis of corporate filings. From mid-February through the end of March, our expert team of human analysts will be coming in early and staying late to validate the models built by the Robo-Analyst and interpret unusual items that are not automatically processed.
Last year, from February 17, 2020 through March 31, 2020, our Robo-Analyst parsed and analyzed 2,522 10-Ks and 10-Qs and collected over 254,000 data points. Our analyst team used this data to make 40,617 Core Earnings, balance sheet, and valuation adjustments with a dollar value of $19 trillion. See Figure 3.
Figure 3: Filing Season 2020 – Power of the Robo-Analyst
Sources: New Constructs, LLC and company filings.
The adjustments were applied as follows:
- 14,422 income statement adjustments with a total value of $1.2 trillion
- 17,629 balance sheet adjustments with a total value of $8.0 trillion
- 8,566 valuation adjustments with a total value of $9.9 trillion
This combination of technology and human expertise enables investors to overcome the inaccuracies, omissions and biases in legacy fundamental research and make more informed investment decisions. Look for our Filing Season Finds Reports over the coming weeks, which will feature items found during the real earnings season.
This article originally published on February 22, 2021.
Disclosure: David Trainer, and Kyle Guske II, and Matt Shuler receive no compensation to write about any specific stock, sector, style, or theme.
Follow us on Twitter (#filingseasonfinds), Facebook, LinkedIn, and StockTwits for real-time alerts on all our research.
[1] From Core Earnings: New Data and Evidence: “The average total non-core-earnings items identified amounts to 19% of average Net Income.” – pp. 3, 2nd para.
[2] Only our “novel database” enables investors to overcome flaws with legacy fundamental datasets and apply reliable fundamental data that analyzes all the footnotes & MD&A in their research.


