
Core Earnings[1] for the S&P 500 reached record heights in 2Q22 (details here). However, this earnings power is unevenly distributed amongst S&P 500 constituents. Nearly 50% of the S&P 500’s Core Earnings comes from just 41 companies representing only 8% of the number of firms in the index but over 40% of the index’s market capitalization. Deeper analysis reveals that these companies trade at lower valuations compared to the rest of the index, despite generating disproportionately more core earnings.
In a volatile market, investors can find relative safety in the most profitable companies in the S&P 500. Below, we’ve identified four sectors which have 50% or more of their aggregate Core Earnings[2] concentrated in just five companies. We also reveal where investors are assigning valuation premiums and discounts in the wrong places.
Investors Undervalue Strong Earnings
Per Figure 1, the top 41 companies, based on Core Earnings, in the S&P 500 trade at a price-to-Core Earnings (P/CE) ratio[3]’[4] of 16.4. The rest of the index trades at a P/CE ratio of 22.7. Of course, stock prices are based on future earnings so one could argue that these valuations simply reflect diminished expectations for the 41 companies with the highest Core Earnings. However, as inflation rises and global economic disruptions put pressure on even the most profitable companies, it appears that the market is badly mispricing earnings potential for certain S&P 500 companies.
Among the top 41 Core Earners, 25 receive an Attractive-or-better rating, which indicates an attractive risk/reward tradeoff. We’ve featured several of these top earners as Long Ideas, including Microsoft (MSFT), Alphabet (GOOGL), JPMorgan Chase (JPM), Johnson & Johnson (JNJ), Verizon (VZ), Walmart (WMT), Qualcomm (QCOM), and Ford (F).
Figure 1: Disparity in Earnings and Valuation of the S&P 500

Sources: New Constructs, LLC and company filings.
Below we zoom into the earnings at the sector and company levels to highlight where valuations are not properly aligned with earnings power.
Uneven Distribution in Energy Sector Earnings Power
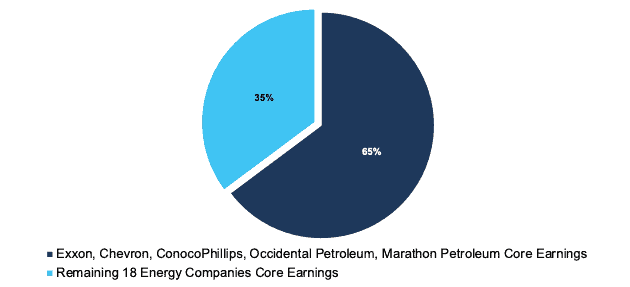
When we look below the surface, we see that the Energy sector’s Core Earnings, at $160.7 billion in 2Q22 are driven largely by just a few companies.
Exxon Mobil (XOM), Chevron Corporation (CVX), ConocoPhillips (COP), Occidental Petroleum Corp (OXY), and Marathon Petroleum (MPC) make up 65% of the sector’s Core Earnings and account for the largest percent of Core Earnings from a sector’s top five companies across any of the S&P 500 sectors.
Put another way, 22% of the companies in the S&P 500 Energy sector generate 65% of the sector’s Core Earnings, which is down from 67% in the TTM ended 1Q22.
Figure 2: Five Companies Generate 65% of Energy Sector’s Core Earnings Profitability
Sources: New Constructs, LLC and company filings.
Top Earners Look Cheap Compared to Rest of Energy Sector
The five companies that make up 65% of the Energy sector’s Core Earnings trade at a P/CE ratio of just 9.2, while the other 18 companies in the sector trade at a P/CE ratio of 11.4.
Per Figure 3, investors are paying a premium for some of the lowest earners in the sector, while the top earning companies (Exxon, Chevron, ConocoPhillips, Occidental Petroleum, and Marathon Petroleum) trade at a discount.
Figure 3: Disparity in Earnings and Valuation of the S&P 500 Energy Sector

Sources: New Constructs, LLC and company filings.
To quantify the expectations for future profit growth, we look at the price-to-economic book value (PEBV) ratio, which measures the difference between the market’s expectations for future profits and the no-growth value of the stock. Overall, the Energy sector’s PEBV ratio through 9/2/22 is 0.6. Three of the five top earning Energy sector stocks trade at or below the PEBV of the overall sector. Additionally, each of the five companies have grown Core Earnings at 20% or higher compound annual growth rates (CAGR) over the past five years, which further illustrates the disconnect between current valuation, past profits, and future profits.
Technology: Digging Deeper Reveals Few Large Winners
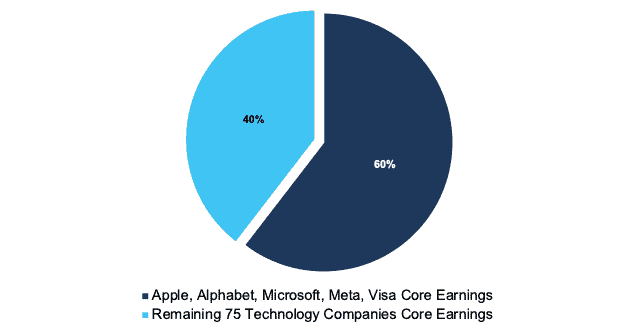
When we look below the surface, we see that the Technology sector’s Core Earnings, at $475.1 billion, are unevenly distributed, though slightly less top heavy than the Energy sector.
Apple Inc. (AAPL), Alphabet, Microsoft, Meta Platforms (META), and Visa (V), make up 60% of the sector’s Core Earnings.
Put another way, 6% of the companies in the S&P 500 Technology sector generate 60% of the sector’s Core Earnings, which is down from 61% in the TTM ended 1Q22.We also find that 10 companies, or 13% of the S&P 500 Technology sector companies, make up 72% of the sector’s Core Earnings.
Figure 4: Only a Few Firms Dominate Technology Sector Profitability
Sources: New Constructs, LLC and company filings.
Not Paying a Premium for Top Earning Technology Sector Companies
The five companies that make up 60% of the Technology sector’s Core Earnings trade at a P/CE ratio of 23.2, while the other 75 companies in the sector trade at a P/CE ratio of 23.8.
Per Figure 5, investors can get the Technology sector’s top earning companies at a slight discount, based on P/CE ratio, to the rest of the Technology sector. We’ve featured three of the top earners, Alphabet, Microsoft, and Intel as Long Ideas and argued each deserves a premium valuation given the respective large scale, strong cash generation, and diversified business operations.
Figure 5: Disparity in Earnings and Valuation of the S&P 500 Technology Sector

Sources: New Constructs, LLC and company filings.
Overall, the Technology sector’s PEBV ratio through 9/2/22 is 1.6. Two of the top five earners trade below the PEBV of the overall sector. Additionally, all five companies have grown Core Earnings at a double-digit CAGR over the past five years, which further illustrates the disconnect between current valuation, past profits, and future profits.
Basic Materials: Digging Deeper Reveals Top Heavy Nature of Sector
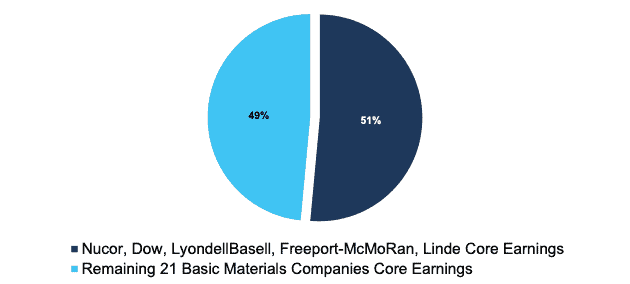
When we look below the surface, we see that the Basic Materials sector’s Core Earnings, at $62.1 billion, are also unevenly distributed, though less so than the Energy and Technology sectors.
Nucor Corporation (NUE), Dow Inc. (DOW), LyondellBasell Industries (LYB), Freeport McMoRan (FCX), and Linde, PLC (LIN), make up 51% of the sector’s Core Earnings.
Put another way, 19% of the companies in the S&P 500 Basic Materials sector generate 51% of the sector’s Core Earnings, which is down from 53% in the TTM ended 1Q22.
Figure 6: Five Firms Dominate Basic Materials Sector Profitability
Sources: New Constructs, LLC and company filings.
Our Core Earnings analysis is based on aggregated TTM data for the sector constituents in the measurement period.
Basic Materials Sector Companies Trade at a Large Discount
The five companies that make up 51% of the Basic Materials sector’s Core Earnings trade at a P/CE ratio of 8.6, while the other 21 companies in the sector trade at a P/CE ratio of 16.5.
Per Figure 7, despite generating over half the Core Earnings in the sector, the top five companies account for just 36% of the entire sector’s market cap and trade at a P/CE ratio nearly half of the other companies in the sector. Investors are effectively putting a premium on lower earnings and under allocating capital to the companies in the sector with the highest Core Earnings through the TTM ended 2Q22.
Figure 7: Disparity in Earnings and Valuation of the S&P 500 Basic Materials Sector

Sources: New Constructs, LLC and company filings.
Overall, the Basic Material sector’s PEBV ratio through 9/2/22 is 0.8. Four of the top five (Linde being the exception) earners trade below the PEBV of the overall sector. Additionally, three of the five companies have grown Core Earnings at a double-digit CAGR over the past five years. One (LyondellBasell) has grown at a 7% CAGR and Dow doesn’t have history dating back five years due to its formation in 2019. These strong historical profit growth rates further illustrate the disconnect between current valuation, past profits, and future profits for these industry leaders.
Real Estate: Digging Deeper Reveals Top Heavy Nature of Sector
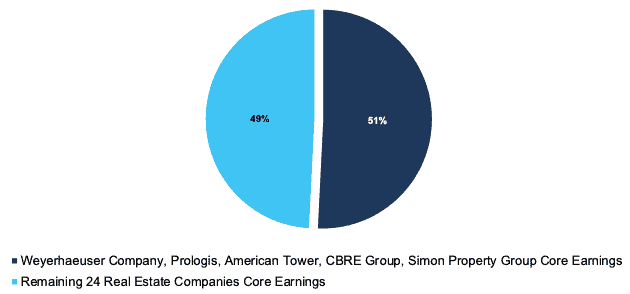
When we look below the surface, we see that the Real Estate sector’s Core Earnings, at $22.4 billion, are also unevenly distributed, though less so than the previous sectors.
Weyerhaeuser Company (WY), Prologis (PLD), American Tower (AMT), CBRE Group (CBRE), and Simon Property Group (SPG), make up 51% of the sector’s Core Earnings.
Put another way, 17% of the companies in the S&P 500 Real Estate sector generate 51% of the sector’s Core Earnings.
Figure 8: Five Firms Dominate Real Estate Sector Profitability
Sources: New Constructs, LLC and company filings.
Our Core Earnings analysis is based on aggregated TTM data for the sector constituents in the measurement period.
Real Estate Sector Companies Trade at a Large Discount
The five companies that make up 51% of the Real Estate sector’s Core Earnings trade at a P/CE ratio of 25.5, while the other 24 companies in the sector trade at a P/CE ratio of 56.2.
Per Figure 9, despite generating over half the Core Earnings in the sector, the top five companies account for just 32% of the entire sector’s market cap and trade at a P/CE ratio more than half of the other companies in the sector. Investors are effectively putting a premium on lower earnings and under allocating capital to the companies in the sector with the highest Core Earnings through the TTM ended 2Q22.
Figure 9: Disparity in Earnings and Valuation of the S&P 500 Real Estate Sector

Sources: New Constructs, LLC and company filings.
Overall, the Real Estate sector’s PEBV ratio through 9/2/22 is 3.4. Four of the top five (American Tower being the exception) earners trade below the PEBV of the overall sector. Additionally, four of the five companies have grown Core Earnings at a double-digit CAGR over the past five years. These strong historical profit growth rates further illustrate the disconnect between current valuation, past profits, and future profits for these industry leaders.
Diligence Matters – Superior Fundamental Analysis Provides Insights
The Core Earnings dominance from just a few firms, coupled with the disconnect in valuation of those top earners, illustrates why investors need to perform proper due diligence before investing, whether it be an individual stock or even a basket of stocks through an ETF or mutual fund.
Those rushing to invest in the Energy, Technology, Basic Materials, or even Real Estate sectors and doing so blindly through passive funds are allocating to a significant amount of firms with less earnings strength than the entire sector as a whole would indicate.
This article originally published on September 8, 2022.
Disclosure: David Trainer, Kyle Guske II, Matt Shuler, and Brian Pellegrini receive no compensation to write about any specific stock, style, or theme.
Follow us on Twitter, Facebook, LinkedIn, and StockTwits for real-time alerts on all our research.
[1] The Journal of Financial Economics features the superiority of our Core Earnings in Core Earnings: New Data & Evidence.
[2] Top four excludes the Telecom Services sector as there are only five companies in the sector.
[3] We calculate this metric based on S&P Global’s (SPGI) methodology, which sums the individual S&P 500 constituent values for market cap and Core Earnings before using them to calculate the metric.
[4] Price as of 9/2/22 and financial data through calendar 2Q22.