As a technological leader, this company is prepared to meet the growing opportunity 5G presents in smartphones, automotive technology, edge computing, and the internet of things (IOT). Diversification of the company’s manufacturing locations helps insulate it from the risks inherent to an industry heavily concentrated in Asia. Qualcomm Inc. (QCOM: $133/share) is this week’s Long Idea.
QCOM presents quality risk/reward given the company’s:
- position to grow with long-term industry tailwinds
- new, large growth opportunities in edge computing and extended reality (XR)
- significant free cash flow (FCF) and research and development (R&D)
- industry-leading 5G technology
- shares are worth $170+ if revenue growth matches industry expectations
Demand for Semiconductors to Grow at the Edge
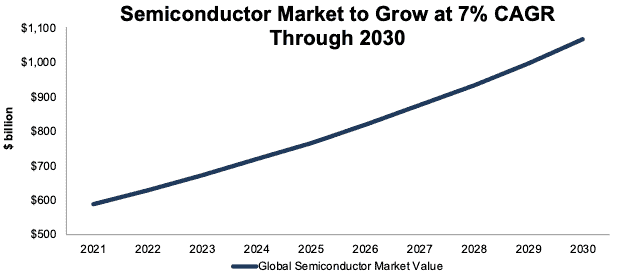
The semiconductor industry is one of the most cyclical in the entire economy and serves as a growth benchmark for many economists. Indeed, some commentators are warning that after 26% year-over-year (YoY) revenue growth in 2021, the industry could be headed for a fall in the near term if a global recession occurs. There could be a short-term decline in semiconductor demand coinciding with an economic slowdown, but we do not expect this brief downturn to derail strong prospects for Qualcomm or the industry at large. Indeed, McKinsey expects the global semiconductor market to continue growing at a 7% CAGR from 2021 through 2030, per Figure 1.
An integral driver of continued semiconductor growth will be edge computing, which will play an increasingly important role in enterprise data processing. Data processing is shifting away from the datacenter toward the edge and driving demand for more powerful local processing capabilities. Designers of high-quality, low-latency, power-efficient chipsets, such as Qualcomm, are positioned to meet demand for chips designed for edge computing. International Data Corporation (IDC) expects global spending on edge computing to grow at a 16% CAGR through 2025, more than twice as fast as the global semiconductor industry.
Figure 1: Global Semiconductor Market Forecast Through 2030
Sources: New Constructs, LLC and McKinsey
New Growth Opportunities Beyond Smartphones
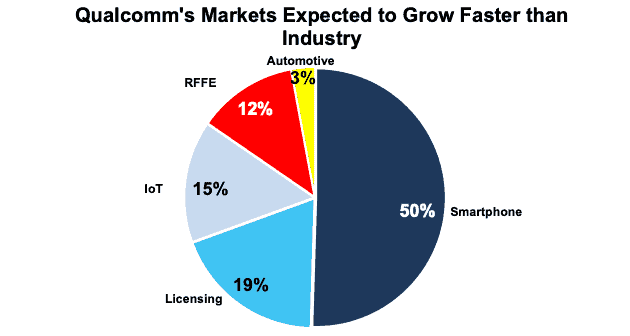
Semiconductors accounted for 81% of Qualcomm’s revenue in fiscal 2021 with half of that coming from the smartphone segment. See Figure 2. All new and fast-growing markets eventually become mature and slow growing markets, even smartphones. Qualcomm’s smart phone semiconductor segment dominates the company’s revenue position, but the company has successfully diversified into other new growth markets.
Fast-growing markets, including internet of things (IoT), radio-frequency front-end (RFFE), and automotive, to name a few, utilize similar technologies as smartphones so they will need plenty of Qualcomm semiconductors. Qualcomm is positioned to adjust its revenue mix along the cutting edge of technology. Indeed, industry researchers project the following markets to grow faster than the overall semiconductor industry:
- Smartphone: 7.6% CAGR through 2030 according to Research And Markets
- Automotive infotainment: 9.3% CAGR through 2030 according to ReportLinker
- RFFE: 15% CAGR through 2028 according to Market Growth Reports
- IoT: 19.7% CAGR through 2030 according to Allied Market Research
- Automotive telematics: 26.1% CAGR through 230 according to Emergen Research
Figure 2: Qualcomm’s Revenue Mix: Fiscal 2021
Source: New Constructs, LLC and company filings.
Increased Data Consumption Drives Processing Demand
Another long-term tailwind for Qualcomm is increased content consumption driven by increased smartphone hardware capabilities. Higher-quality cameras, audio, video, and security within smartphones drives demand for higher quality processors.
Together, the growth in content consumption and edge computing data processing paint a pretty picture for long-term demand for Qualcomm’s high-end, powerful semiconductors.
Metaverse Could Drive Major Growth
Qualcomm’s IoT segment has grown with the increase in popularity of wearables and hearables, which utilize the same technology as smartphones. Beyond wearables, the metaverse offers enormous growth potential for Qualcomm’s IoT segment. Qualcomm’s Snapdragon XR2 5G Platform is the world’s first platform that unites 5G and artificial intelligence, which make it an ideal fit for extended reality (XR) devices. Transparency Market Research estimates the global XR market will grow at a 47% CAGR through 2030. Should Qualcomm’s IoT segment grow at just half the XR industry rate, and its smartphone business grow at the industry-projected CAGR of 7.6%, IoT would overtake smartphones by 2030 as Qualcomm’s largest segment.
Strong Market Position Delivers Significant FCF
For years, investors have poured capital into growth stories with little fundamental substance. As we’ve recently shown, zombie stocks such as Carvana (CVNA), Peloton (PTON), and Freshpet (FRPT) could go to $0/share if their cash-burning businesses lose access to cheap capital.
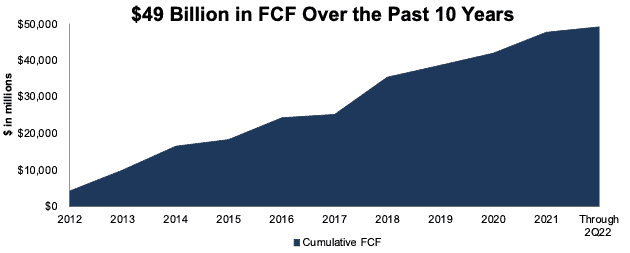
On the other hand, Qualcomm’s formidable free cash flow (FCF) delivers investors security and value in turbulent times. With looming questions about the direction of the economy, investors should seek out businesses with Attractive-or-better Credit Ratings and strong FCF. Qualcomm, with a Very Attractive Credit Rating and cumulative FCF of $49 billion (33% of market cap) since fiscal 2012, fits the bill.
Figure 3: Qualcomm’s Cumulative Free Cash Flow Since Fiscal 2012 Through 2Q22
Sources: New Constructs, LLC and company filings
Qualcomm’s Licensing Model Is a Large Competitive Advantage
Aside from selling semiconductors, Qualcomm licenses its technology, which has positioned the company as a research and development (R&D) center for the smartphone industry. All the major smartphone manufacturers rely on licensing Qualcomm’s technological advancements. Qualcomm has over 150 5G licensing agreements (up from over 100 in 2020), which makes it the most widely licensed 5G provider in the industry. Qualcomm’s licensing portfolio will become even more valuable with the growth of 5G. Currently, 5G devices account for 53% of global smartphone shipments, but International Data Corporation (IDC) expects 5G devices to reach 78% volume share in 2026.
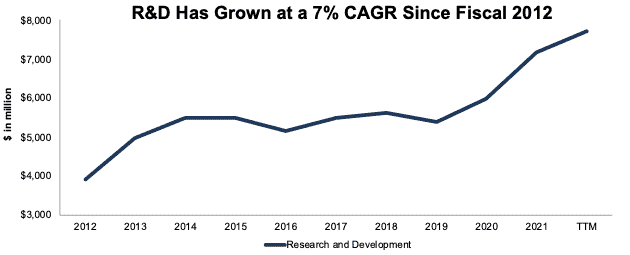
Qualcomm has achieved its technology leadership position through significant research and development (R&D) spending. The company’s large FCF means the company can continue to support investments in its licensing business and maintain its technological advantage over android competitors and at least for now, over Apple's (AAPL) 5G modems. Per Figure 4, Qualcomm has grown its annual R&D expense from $3.9 billion in fiscal 2012 to $7.7 billion over the trailing twelve months (TTM). For comparison, Qualcomm’s largest smartphone competitor, MediaTek, spent ~$3.5 billion on research and development in 2021.
Figure 4: Research and Development Expense: Fiscal 2012 Through TTM
Source: New Constructs, LLC and company filings
Qualcomm’s Improved Operating Efficiency
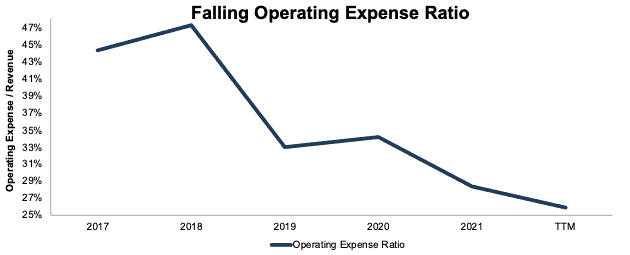
Companies often experience a rise in operating expenses as they seek to establish or maintain a competitive market position. Qualcomm, however, has managed to grow revenue and maintain its market dominance while controlling operating expense as the smartphone industry has accelerated its adoption of 5G technology. Per Figure 5, over the past five years, Qualcomm’s operating expense ratio (operating expense as a percent of revenue) has fallen from 44% in fiscal 2017 to 26% TTM.
Figure 5: Operating Expense Ratio: Fiscal 2017 Through TTM
Source: New Constructs, LLC and company filings
Executive Compensation Plan Creates Value for Shareholders, for Now
No matter the macro environment, investors should look for companies with executive compensation plans that directly align executives’ interests with shareholders’ interests. Quality corporate governance holds executives accountable to shareholders by incentivizing them to allocate capital prudently.
The company compensates executives through base salaries, cash bonuses, performance-based equity awards, and time-based equity awards.
Half of executives’ fiscal 2019 performance stock units (PSUs) are tied to a target three-year average adjusted ROIC (fiscal 2020 – 2022). Tying executive compensation to ROIC, which evaluates the company’s true returns on the total amount of capital invested in the company, ensures that executives’ interests are actually aligned with shareholders’ interests as there is a strong correlation between improving ROIC and increasing shareholder value.
However, unlike fiscal 2019 PSUs, Qualcomm’s fiscal 2020 and fiscal 2021 PSUs are tied to adjusted three-year EPS instead of an ROIC target. Investors should pay close attention to the company’s fiscal 2022 PSUs. Should Qualcomm’s fiscal 2022 PSUs not tie to an ROIC target, then shareholders will no longer be assured that executives’ interests line up with their own.
Qualcomm’s focus on ROIC has helped the company grow economic earnings from $3.0 billion in fiscal 2017 to $9.2 billion over the TTM.
Improving Profitability
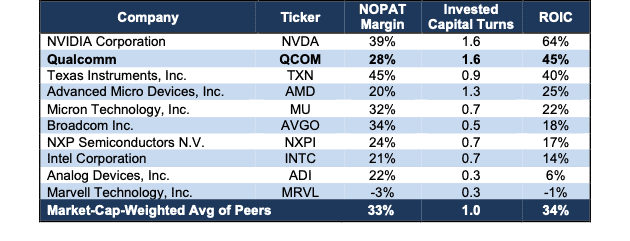
With strategic investments in industry-leading 5G technology, a falling operating expense ratio, and executive compensation plan aligned with shareholder’s interests, it comes as no surprise that Qualcomm’s profitability has improved over the past five years. The company’s NOPAT margin has risen from 20% in fiscal 2017 to 28% TTM, while invested capital turns rose from 1.1 to 1.6 over the same time. Rising margins and invested capital turns have driven Qualcomm’s from 21% in fiscal 2017 to 45% TTM.
The company’s return on invested capital (ROIC) is second among the 10 largest (by market cap) semiconductor companies under coverage. See Figure 6.
Figure 6: Qualcomm’s Profitability Vs. Largest Peers: TTM
Sources: New Constructs, LLC and company filings
Core Earnings Are Rising
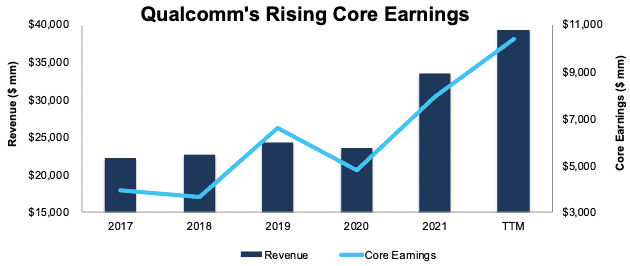
Qualcomm’s business has remained profitable despite the extreme cyclicality of the semiconductor industry. In each of the past 24 years (earliest available data), Qualcomm has generated positive Core Earnings. More recently, the company has grown Core Earnings from $3.9 billion in fiscal 2017 to $10.4 billion over the TTM. Given the company’s large share of the 5G mobile semiconductor market, and the optimistic outlook for the semiconductor industry through 2030, Qualcomm is positioned for more profit growth throughout the decade.
Figure 7: Qualcomm’s Revenue & Core Earnings Since Fiscal 2017
Sources: New Constructs, LLC and company filings.
Qualcomm Is Growing Despite Cyclical Headwinds
IDC expects global smartphone shipments to decline 3.5% YoY in 2022 as a result of manufacturing and supply chain disruptions from lockdowns in China. Additionally, China’s struggling economy means softer demand for the world’s largest smartphone market, which represents ~22% of global smartphone shipments. IDC expects shipments inside of China to fall 11.5% in 2022.
Qualcomm’s leadership in the growing premium 5G space, and its success in its non-smartphone segments has resulted in significant revenue growth in fiscal 2022, despite industry smartphone shipment headwinds. The company’s TTM revenue was 34% higher YoY in fiscal 2Q22.
Qualcomm Benefits from Shift Away from China
The smartphone manufacturing industry’s heavy concentration in China is a long-term risk for the entire industry and its suppliers. Before the pandemic, China’s share of global smartphone shipments fell from 74% in 2016 to 68% in 2020 (latest available data). Over the long term, increased tensions between the U.S. and China could drive a shift away from China and areas where it has geostrategic interests, such as Taiwan.
As a fabless designer, Qualcomm has the flexibility to change production facilities, and the company has greater supply diversification than its peers. Should U.S. relations with China deteriorate further, the company will be able to move its operations to the growing number of foundries outside of Taiwan. Its largest suppliers, Global Foundries (GFS), Samsung Electronics (SSNLF), and even Taiwan Semiconductor (TSM) are quickly adding manufacturing capacity outside of Asia. Qualcomm has already signed on to have Intel’s (INTC) new foundry business manufacture some of its chips, as well. Of course, for Qualcomm’s diversification plans to be realized these other companies will need to execute.
So far, Qualcomm’s position in the market has enabled it to achieve strong profit growth since the industry began to shift reliance away from China in 2016. Qualcomm’s TTM Core Earnings of $10.4 billion are nearly double fiscal 2016 levels.
Compared to its main competitor, Taiwan-based MediaTek, Qualcomm has less exposure to geopolitical disruption involving China. Should China become more aggressive with Taiwan, MediaTek’s operations, along with its fab supplier Taiwan Semiconductor Manufacturing Company could be heavily disrupted. In such an event, U.S.-based Qualcomm, with a more diversified manufacturing portfolio would be better positioned to take share away from MediaTek.
Leading From the Front
The emergence of MediaTek in the smartphone market may have some wondering if Qualcomm’s days of mobile dominance are numbered. However, Qualcomm’s strategic shift toward high-end processors has helped the company maintain its revenue dominance of the smartphone semiconductor industry. In 1Q22, Qualcomm’s share of global smartphone chipset revenue was 44%, more than twice MediaTek’s.
Qualcomm market strength is most pronounced in premium markets. For android phones priced more than $300, Qualcomm holds a 63%+ share of the global volume, and the company’s share of the 5G chipset market was 76% in 4Q21.
With its fiscal 2021 R&D expense twice what MediaTek spent, Qualcomm is well-positioned to maintain its technological lead and dominance of the premium android smartphone market.
Shares Are Undervalued
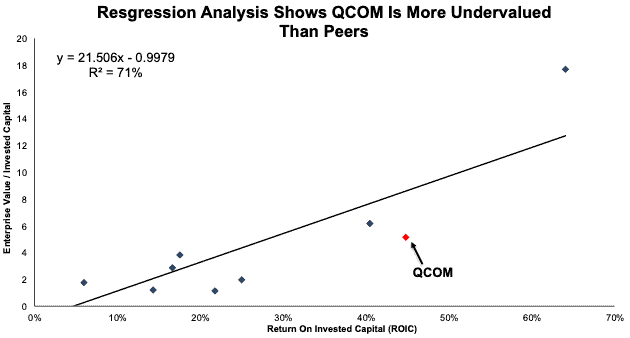
Though Qualcomm has the second highest ROIC amongst its large peers, the company’s shares are relatively more undervalued than its peer group. Per Figure 8, ROIC explains 71% of the difference in valuation for the peer group, and QCOM trades at a large discount to the group. If the stock were to trade at parity with its peers, it would be worth $210+/share, or 58%+ above the current price.
Figure 8: ROIC Regression Analysis: Qualcomm Vs. Peers
Sources: New Constructs, LLC and company filings
Below, we use our reverse discounted cash flow (DCF) model to quantify the expectations baked into Qualcomm’s stock price, as well as the upside potential in the stock should the company grow in line with semiconductor industry growth projections in the coming years.
DCF Scenario 1: to Justify the Current Stock Price.
We assume Qualcomm’s:
- NOPAT margin falls to its three-year average of 26% (vs. TTM of 28%) in fiscal 2022 through 2031 and
- revenue grows just 4% from fiscal 2021 - 2031
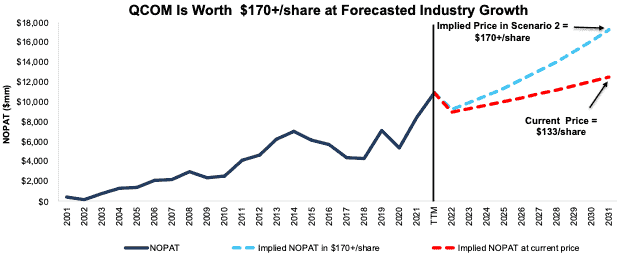
In this scenario, Qualcomm’s NOPAT grows 4% compounded annually (versus WACC of 7.2%) over the next 10 years and the stock is worth $132/share today – nearly equal to the current price. For reference, Qualcomm’s NOPAT has grown 18% compounded annually since fiscal 2017.
DCF Scenario 2: Shares Are Worth $170+ at Industry Growth Forecast.
If we assume Qualcomm’s:
- NOPAT margin falls to 26% and
- revenue grows at a 7% CAGR through fiscal 2031 (equal to McKinsey’s industry forecast of 7% CAGR through 2030), then
QCOM is worth at least $170+/share today – a 28% upside to the current price. In this scenario, Qualcomm’s NOPAT grows just 7.5% compounded annually through fiscal 2031. In this scenario, Qualcomm’s ROIC in fiscal 2031 is just 37%, which is below its 10-year average ROIC of 38%. Should Qualcomm continue to improve its ROIC from current levels, the stock has even more upside.
Figure 9 compares Qualcomm’s historical NOPAT to the NOPAT implied in each of the above DCF scenarios.
Figure 9: Qualcomm’s Historical and Implied NOPAT: DCF Valuation Scenarios
Sources: New Constructs, LLC and company filings.
Sustainable Competitive Advantages Will Drive Shareholder Value Creation
Here’s a summary of why we think the moat around Qualcomm’s business will enable it to continue to generate higher NOPAT than the current market valuation implies. The following competitive advantages also help Qualcomm generate strong cash flows for decades to come:
- dominant share of the premium smartphone market
- 5G technological leadership
- geographical supplier diversification
- high profitability compared to peers
What Noise Traders Miss with Qualcomm
These days, fewer investors focus on finding quality capital allocators with shareholder friendly corporate governance. Instead, due to the proliferation of noise traders, the focus is on short-term technical trading trends while more reliable fundamental research is overlooked. Here’s a quick summary of what noise traders are missing:
- projected growth of the global semiconductor industry through 2030
- opportunity new verticals create
- valuation implies QCOM is much cheaper than the stocks of other semiconductor peers
Earnings Beats, Stronger than Expected Demand, or Lifting of Lockdowns Could Send Shares Higher
Qualcomm has beaten earnings estimates in each of the past 12 quarters and doing so again could send shares higher.
Concerns over weakening demand in 2022 loom over the industry. Should semiconductor shipments outperform expectations, Qualcomm’s shares could climb above current levels.
Further, should the lockdown restrictions that have reduced smartphone production in China finally ease, demand for the company’s semiconductors and stock could soar.
Dividends and Share Repurchases Provide 4.7% Yield
Qualcomm has paid a dividend every year since fiscal 2003. Since fiscal 2017, Qualcomm has paid $15.6 billion (10% of market cap) in cumulative dividends. The company’s current dividend, when annualized provides a 2.3% yield.
Qualcomm also returns capital to shareholders through share repurchases. From fiscal 2017 – 2021, the company repurchased $31.5 billion (21% of market cap) of stock. Over the TTM, the company has repurchased $3.5 billion worth of shares. Should the company continue repurchases at its current rate, the buybacks would provide an annual yield of 2.4% at its current market cap. Combined with a dividend yield of 2.3%, investors would see a 4.7% yield on their shares.
Insider Trading and Short Interest Trends
Over the past 12 months, insiders have purchased 13 thousand shares and have sold 165 thousand shares for a net effect of 152 thousand shares sold. These sales represent less than 1% of shares outstanding.
There are currently 6.6 million shares sold short, which equates to 3% of shares outstanding and just under six days to cover. Short interest is down 8% from the prior month. The lack of short interest reveals not many are willing to take a stake against this free cash flow generator.
Critical Details Found in Financial Filings by Our Robo-Analyst Technology
Fact: we provide more reliable fundamental data and earnings models – unrivaled in the world.
Proof: Core Earnings: New Data & Evidence, forthcoming in The Journal of Financial Economics.
Below are specifics on the adjustments we make based on Robo-Analyst findings in Qualcomm’s 10-K and 10-Qs:
Income Statement: we made $1.9 billion of adjustments, with a net effect of removing $618 million in non-operating income (2% of revenue). Clients can see all adjustments made to Qualcomm’s income statement on the GAAP Reconciliation tab on the Ratings page on our website.
Balance Sheet: we made $24.0 billion of adjustments to calculate invested capital with a net decrease of $8.0 billion. One of the largest adjustments was $5.4 billion in asset write-downs. This adjustment represented 19% of reported net assets. Clients can see all adjustments made to Qualcomm’s balance sheet on the GAAP Reconciliation tab on the Ratings page on our website.
Valuation: we made $27.5 billion of adjustments to shareholder value for a net effect of decreasing shareholder value by $6.0 billion. Apart from total debt, one of the most notable adjustments to shareholder value was $10.8 billion in excess cash. This adjustment represents 7% of Qualcomm’s market cap. Clients can see all adjustments to Qualcomm’s valuation on the GAAP Reconciliation tab on the Ratings page on our website.
Attractive Funds That Hold QCOM
The following funds receive our Attractive rating and allocate significantly to QCOM:
- Matrix Advisors Dividend Fund (MADFX) – 4.7% allocation
- Pacer U.S. Cash Cows Growth ETF (BUL) - 4.7% allocation
- White Oak Select Growth Fund (WOGSX) - 4.4% allocation
- Matrix Advisors Value Fund, Inc (MAVFX) - 4.0% allocation
- First Trust NASDAQ Technology Dividend Index Fund (TDIV) – 3.4% allocation
This article originally published on July 13, 2022.
Disclosure: David Trainer, Kyle Guske II, Matt Shuler, and Brian Pellegrini receive no compensation to write about any specific stock, style, or theme.
Follow us on Twitter, Facebook, LinkedIn, and StockTwits for real-time alerts on all our research.

