Wednesday was a rough day for the market, especially the many super expensive tech stocks. Of course, our Zombie Stocks got crushed and that portfolio did great.
Not surprisingly, a few more Wall Street strategists jumped on the bearish bandwagon.
But, do we know if this is it…is it the correction that everyone with a fundamental hair on their head knows is coming, knows we need?
I’m going to reveal a few special ideas in this letter:
- Trends from our proprietary macro research, usually reserved for our Institutional clients,
- The real impact of a Trump presidency on the markets,
- The best stocks to buy and sell in this market.
About 15 years ago, a very smart client told me that corrections are not caused by valuation or anything related to fundamentals. He said you need a liquidity crunch to catalyze a sustained correction and a bear market.
Do you think regulators and politicians have picked up on this idea? Haha! We’ve seen unprecedented liquidity pouring into our markets and economy ever since COVID.
Unprecedented.
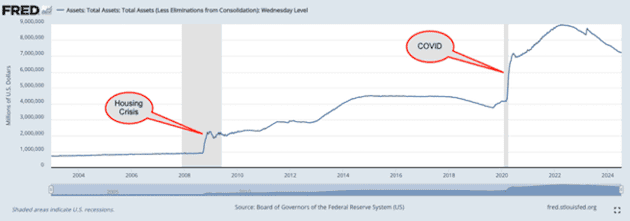
Take a look at Figure 1 and see the huge jump in assets on the Federal Reserve Bank’s balance sheet when COVID hit. Compare that jump to the one during the housing crisis. It looks 3-4x larger. It appears that regulators and politicians really leaned into the idea of flooding the economy with money during COVID after seeing how well it worked in 2009.
Also, note that the excess liquidity pumped into the system in 2009 was never taken out. Quite the opposite, it only went higher before the next big jump during COVID.
I think regulators and politicians are liquidity junkies now. They’re hooked like a drug addict on the short-term fix-all for any economic problems: give the economy more money.
Figure 1: Total Assets on the Federal Reserve’s Balance Sheet Remain Elevated
Sources: Federal Reserve Bank of St. Louis website
Looking at a shorter time frame, we see that the Assets have been coming down this year though not by a lot. We are nowhere near getting back to pre-COVID levels, and I am not confident that we ever will.
Figure 2: Total Assets on the Federal Reserve’s Balance Sheet Are Coming Down
Sources: Federal Reserve Bank of St. Louis website
So, why is the market still going up if the Federal Reserve Bank is reducing its balance sheet?
Answer: because the Federal government is putting fiscal stimulus into the economy faster than the Fed is reducing its balance sheet.
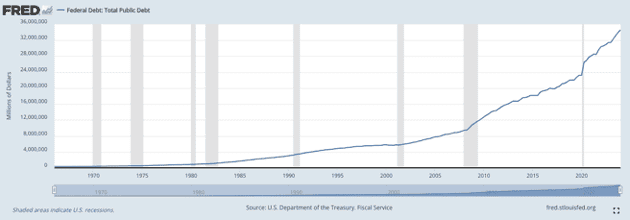
Figure 3: Federal Debt Has Skyrocketed in the Last 20 Years
Sources: Federal Reserve Bank of St. Louis website
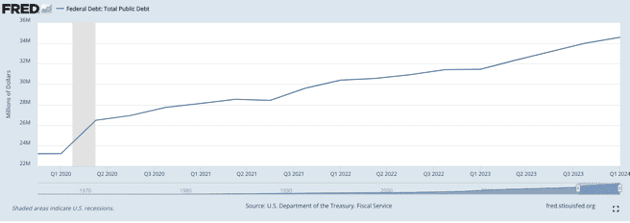
Figure 4 plots the total Federal debt over a similar time period as the Federal Reserve Bank’s Assets in Figure 2. Note that the debt data is only through the end of 2023, but I think we all know that our unchecked Federal spending has gone up not down in 2024. In other words, the trend for Federal debt is going up at the same rate or faster than what we saw in 2023.
The takeaway here is that there are two primary ways that the government can stimulate the economy by putting more money into it:
- Monetary stimulus – comes from the Federal Reserve.
- Fiscal stimulus – comes from the Federal government.
Investors need to look at both to know what’s really going on.
Figure 4: Federal Debt Rise Offsets Fed Assets Decline
Sources: Federal Reserve Bank of St. Louis website
And, when we look at both monetary and fiscal stimulus patterns today, it’s pretty clear that no one is taking away the punch bowl from the stock market party yet.
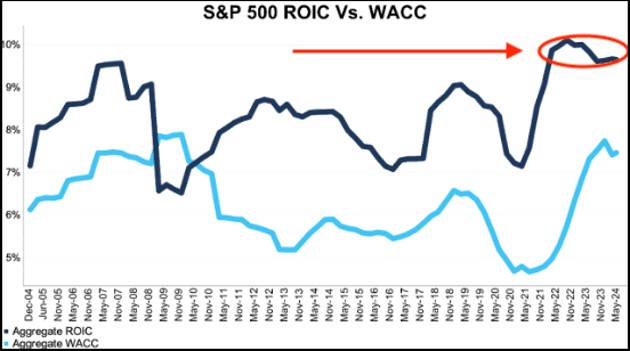
Now, adding money to the economy is not necessarily a bad thing. Adding money is good if it is being used well. Unfortunately, our research shows it is not being used well. Figure 5 shows that the return on capital employed (what we call ROIC) by the S&P 500 companies is in decline over the past two years. Figure 5 is an example of the macro fundamental research we’ve done for clients almost every quarter for the last several years for the S&P 500 as well as the overall market.
Figure 5: Return on Invested Capital (ROIC) for the S&P 500 is in Decline
Sources: New Constructs and Company Filings in this report
We do this research on all the key metrics: economic earnings, economic book value, Core Earnings, GAAP earnings, NOPAT margins, invested capital turns, and free cash flow.
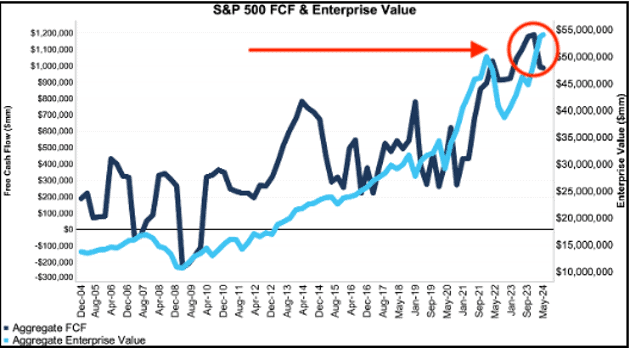
Speaking of free cash flow, Figure 6 shows free cash flow is in decline for the S&P 500 while enterprise value is rising.
Figure 6 is a great summary of all the charts to this point as it shows profits are down while valuations are up. Not a good combination for investors in the stock market. Nevertheless, as noted above, nothing stops the market from going up as long as more money keeps getting pumped into the economy.
Figure 6: Free Cash Flow the S&P 500 is Down While Enterprise Value Rises
Sources: New Constructs and Company Filings in this report
All this information leads me to believe that maybe the reason stocks are getting pummeled the last few days is because the market believes that Mr. Trump will take away the punch bowl.
In other words, the Trump Trade that no one else is talking about is that the former President, if elected, will act on his long-standing promises to shrink government spending, which will reduce or stop the flow of money into the economy. In turn, the market will lose the liquidity boost that’s driven it up so much the last several years.
If this theory is right, then, given their forward-looking nature, the markets are already beginning to discount the impact of reduced liquidity, and a larger market correction is in our near future.
If that is the case, there’s never been a better time to make sure you do not own any of the stocks on our Zombie Stock list (free here for our readers) or in our Most Dangerous Stocks and Focus List: Short Model Portfolios (not free and worth every penny).
For example, here’s how much damage (as of July 1) investors could have avoided if they kept up with our Zombie Stock picks, many of which are also in our Focus List: Short Model Portfolio:
- Peloton (PTON) – down 70% and down 110% more than the S&P 500
- Beyond Meat (BYND) – down 60% and down 94% more than the S&P 500
- AMC Entertainment (AMC) – down 98% and down 125% more than the S&P 500
And, if you’re going to be in any stocks at all, I think the best stocks to get you through the coming storm are in our Focus List: Long and Most Attractive Stocks Model Portfolios. Also, be sure to check our featured Long Ideas. These are the stocks picks, by the way, that largely drive our #1 rankings for stock picking for 37 consecutive months on Sum Zero.
As always, we are 100% transparent in all of our research, reports, ratings, and models. We regularly review our work and research on Long Ideas and Danger Zone Ideas with clients. We want you to know how much work we do! Here’s how we share our work:
- Free live Podcast every month. The next one is on Friday, July 19th, register here. Get free replays from our online community (use this form to sign up for free) and ask questions and make requests anytime!
- Join our online community (use this form to sign up for free) and ask questions and make requests anytime! Lots of smart investors talking to each other is a good thing.
- Monthly Let’s Talk Long Ideas webinars where we do deep dives into our research, analytics, reverse DCF models and ideas for our Professional and Institutional clients. Our next one is on July 23rd at 5:00pmET. Replays are here for our Professional and Institutional clients.
If this message resonated with you and you want to start your investing future with us – schedule a meeting with us here.
Diligence matters,
David
This article was originally published on July 18, 2024.
Disclosure: David Trainer, Kyle Guske II, and Hakan Salt, receive no compensation to write about any specific stock, sector, style, or theme.
Questions on this report or others? Join our online community and connect with us directly.

