
This report focuses on providing investors the true costs incurred when investing in Sector ETFs and mutual funds. A key component of our fund ratings, total annual costs (TAC), accounts for all the costs borne by investors, including transaction costs and many other fees. Expense ratios often drastically understate the total cost of a fund.
Figure 1 shows ETFs and mutual funds across all sectors whose expense ratios understate their TACs by the most.
Figure 1: Funds With Most Misleading Expense Ratios
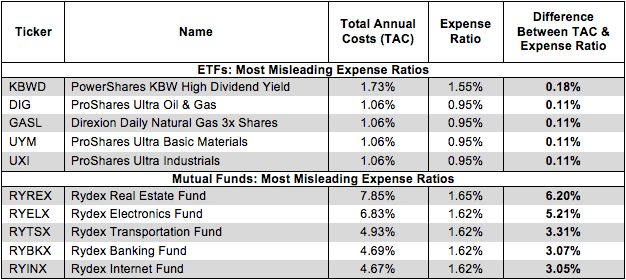
Source: New Constructs, LLC and company filings
PowerShares KBW High Dividend Yield Financial Portfolio ETF (KBWD) is the sector ETF with the greatest disparity between its TAC and expense ratio. Although the spread appears to be negligible right now, it will quickly add up over time. More importantly, investors deserve to know the true costs of being in any ETF. Rydex Real Estate Fund (RYREX) has the most misleading expense ratio amongst all sector mutual funds as its expense ratio is 6.20 percentage points lower than its actual total annual costs.
6.20 percentage points is a large difference. Over just ten years, 6.20% compounds to 82%. Most investors would like to know about such a large additional cost before they put their money into RYREX.
The key takeaway for investors here is that they should focus on the total annual cost of ETFs and mutual funds rather than just the expense ratios, which can significantly understate the costs of being in a fund.
Sector ETFs have an average TAC of 0.54%, while sector mutual funds have an average of 2.33%. We recommend investors focus on funds with TACs below these averages, while avoiding funds that charge far above-average. We have found that funds charging far above-average TACs face extreme difficulty consistently earning returns above a less-expensive benchmark.
Figure 2 shows the number of sector ETFs and mutual funds with TACs above the average and below the average.
Figure 2: Number of Funds With Above and Below Average Total Annual Costs (TACs)
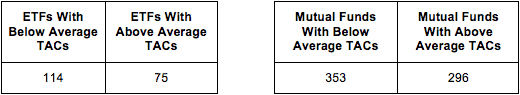
Source: New Constructs, LLC and company filings
Our Sector Ratings for ETFs and Mutual Funds reveal our predictive ratings on the best and worst sectors based upon the ratings of ETFs and funds within each sector.
Disclosure: David Trainer and Kyle Guske II receive no compensation to write about any specific stock, sector or theme.
Photo Credit: OTA Photos (Flickr)