
GAAP Earnings are a flawed metric because of the numerous accounting rule loopholes that open the door for legal earnings manipulation.
Rather than fix this problem, Wall Street’s solutions (non-GAAP earnings, whisper numbers, and Street Earnings[1]) make it worse. That’s right, non-GAAP earnings, whisper numbers, and Street Earnings tend to be more misleading than GAAP Earnings. Don’t believe us? See Figure 4.
A Real Solution
Rather than rely on flawed GAAP or Street Earnings, we use FinSights, our AI agent built for us by Google Cloud, to find companies most likely to miss consensus earnings. Like all of our research, FinSights is fueled by the proprietary data from our Robo-Analyst AI, which analyzes the footnotes of financial filings to calculate Core Earnings, a proven superior measure of earnings.
In this report, we’ll show:
- the frequency and magnitude of overstated GAAP Earnings in the S&P 500,
- Street Earnings are flawed and misleading,
- how Core Earnings generate novel alpha, and
- the five S&P 500 companies most likely to miss Street estimates next quarter.
GAAP Earnings Overstate Core Earnings for 1/3 of the S&P 500
In the trailing-twelve-months (TTM) as of 3/24/26, 34% of the companies in the S&P 500 reported GAAP Earnings that are higher than Core Earnings. These 170 companies with overstated GAAP Earnings make up 52% of the market cap of the S&P 500 as of March 24, 2026.
The median amount that GAAP Earnings overstate Core Earnings is 6%, per Figure 1.
Figure 1: Median S&P 500 GAAP Earnings Overstated by 6%

Sources: New Constructs, LLC and company filings.
Core Earnings Drive Real Alpha
Core Earnings are a proven-superior measure of earnings that generate alpha. Don’t believe us? Look no further than the outperformance of the Bloomberg New Constructs Core Earnings Leaders Index (ticker: BCORET:IND), which beat the S&P 500 Total Return by 897 basis points in 2025. The index beat the S&P 500 by 28% over the past five years through March 27, 2026.
The index invests in stocks based entirely on Core Earnings power. Its outperformance provides compelling evidence of the value in our proprietary measure of Core Earnings.
Figure 2: Bloomberg New Constructs Core Earnings Leaders Total Return Index: 2025 Performance
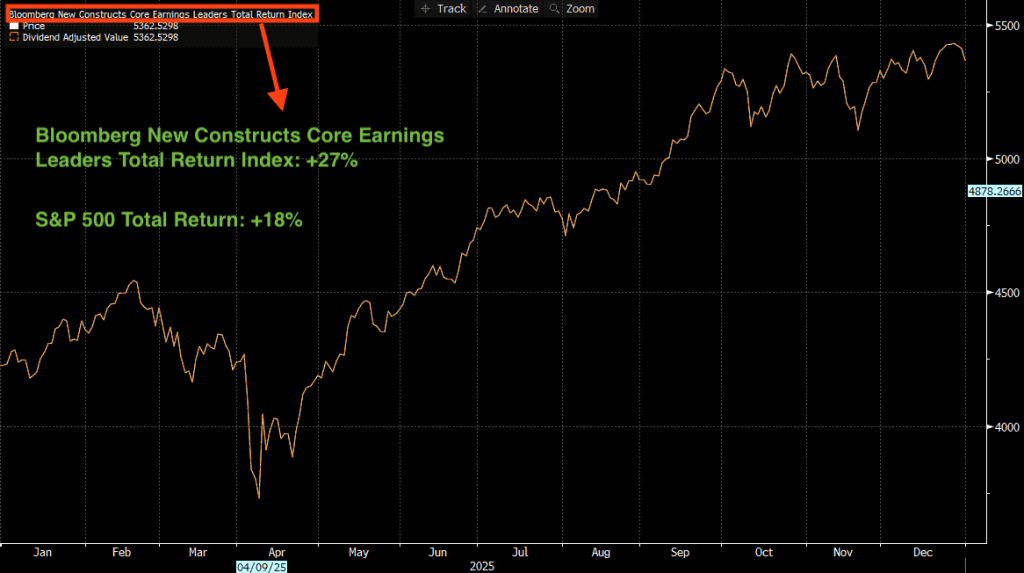
Sources: Bloomberg as of December 31, 2025
Note: Past performance is no guarantee of future results.
S&P 500 Companies Most Likely to Miss Calendar 1Q26 Earnings
Figure 3 shows the S&P 500 companies with an Unattractive or Very Unattractive Stock Rating and Miss or Strong Miss Street Earnings Distortion Score that are likely to miss calendar 1Q26 earnings because their Street EPS estimates are too high.
Stocks in Figure 3 are ranked by Street Earnings Distortion Capture, which is the difference between Core EPS estimates and Street EPS estimates divided by Total Assets. This calculation is similar to our GAAP Earnings Distortion calculation, but uses Street Earnings instead of GAAP Earnings.
Figure 3: S&P 500 Companies Likely to Miss Calendar 1Q26 EPS Estimates
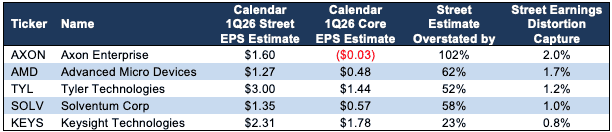
Sources: New Constructs, LLC, company filings, and Yahoo Finance.
To calculate Core Earnings estimates, we forecast next quarter’s Core Earnings based on historical average Core Earnings margins and consensus revenue estimates.
Solventum’s 1Q26 Street Earnings Estimate Overstated by $0.78/share
The difference between, or Street Distortion in, Solventum’s (SOLV) Street EPS Estimate ($1.35/share) and Core Earnings estimate ($0.57/share) is $0.78/share, or 58% percent of Street Earnings estimates.
Solventum’s GAAP Earnings Distortion (GAAP earnings estimate minus Core Earnings estimate) is actually much better (lower), at -$0.12/share, which indicates that Street Earnings are adjusting GAAP even more than required to calculate true profitability and likely missing the material unusual items reported in GAAP earnings.
Figure 4: Comparing Solventum’s GAAP, Street, and Core Earnings Estimates: 1Q26
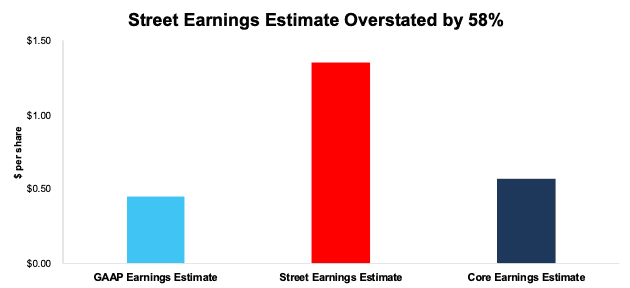
Sources: New Constructs, LLC, company filings, and Yahoo Finance.
How We Reconcile Solventum’s GAAP Earnings to Core Earnings
In the section below, we detail the hidden and reported unusual items that distort GAAP Earnings for Solventum in 2025 as a real-world example of the work we do for all companies we cover. We remove all of these unusual income and expense items from Core Earnings.
We provide these details so readers can audit our research. We would be happy to reconcile our Core Earnings with Street Earnings but cannot because there is no transparency into how the analysts derive Street Earnings.
Solventum’s Street Earnings Distortion Score and GAAP Earnings Distortion Score are Strong Miss and the stock earns a Very Unattractive Stock Rating. Solventum receives a Very Unattractive rating due to its negative economic earnings, return on invested capital (ROIC) of 5%, and expensive stock price.
Despite trading at $65/share, Solventum has an economic book value (EBV), or no-growth value, of just $21/share in large part because of its low ROIC and present value of total debt of $5.4 billion.
Solventum has a market-implied growth appreciation period (GAP) of greater than 100 years based on our Robo-Analyst’s default scenario in our reverse discounted cash flow (DCF) model.
Figure 5 details the differences, what we call “GAAP Earnings Distortion”, between Solventum’s 2025 Core Earnings and GAAP Earnings.
Figure 5: Solventum’s GAAP Earnings to Core Earnings Reconciliation: 2025
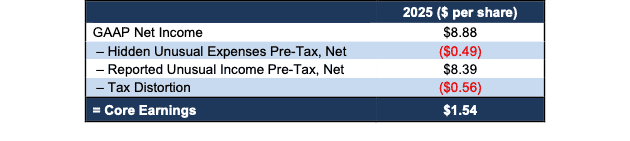
Sources: New Constructs, LLC and company filings.
Details on Key Data Found in the Footnotes
Solventum’s 2025 GAAP EPS are $8.88, and Core EPS are $1.54. The difference is GAAP Earnings Distortion of $7.33/share, or $1.3 billion, and is comprised of the following:
Hidden Unusual Expenses Pre-Tax, Net = -$0.49/share, which equals -$86 million and is comprised of:
- -$52 million in cost of product, SG&A, and R&D expenses related to the “Transform for the Future” restructuring
- -$27 million in cost of product, SG&A, and R&D expenses related to the “Solventum Way” restructuring
- -$7 million in acquisition-related expenses
Reported Unusual Income Pre-Tax, Net = $8.39/share, which equals $1.5 billion and is comprised of:
- $1.5 billion gain on sale of business
- $42 million contra adjustment for recurring pension costs. These recurring expenses are reported in non-recurring line items, so we add them back and exclude them from Earnings Distortion.
- -$121 million in other expenses and loss on debt extinguishment
Tax Distortion = -$0.56/per share, which equals $99 million
Given that the majority of GAAP Earnings Distortion listed above is reported, specifically the $1.5 billion gain on sale of the Purification and Filtration business, unknowing investors may assume Street Earnings properly adjust for all these items.
However, with large Street Distortion in Solventum’s 1Q26 earnings estimate, it’s clear that our Core Earnings include a more comprehensive set of unusual items to calculate a superior measure of profitability.
This article was originally published on March 30, 2026.
Disclosure: David Trainer and Kyle Guske II receive no compensation to write about any specific stock, style, or theme.
Questions on this report or others? Join our online community and connect with us directly.
[1] Street Earnings refers to S&P Global’s normalized EPS, which are adjusted to reflect cycles of the economy, as well as removing unusual or one-time expenses that do not reflect the usual operations of the company.