
Wall Street is expecting double-digit declines in Q2 earnings amid the coronavirus-driven recession, but we believe companies are in much better shape than many analysts think.
That’s why the stock market rebounded so strongly from the March bottom. We think there is even more upside ahead as more investors realize earnings aren’t as bad as estimates suggest.
Aside from having to conduct earnings calls remotely, companies will be faced with the daunting task of communicating the spike in COVID-19-related write-offs and unusual expenses (like employee severance and work-from-home costs) this earnings season.
Wall Street is focused on overly pessimistic numbers. We encourage investors to look past these short-term write-offs and focus on Core Earnings, which better reflect the normal performance of the business.
Even in the best of times, legacy earnings estimates such as I/B/E/S from Refinitiv and Operating Earnings from S&P Global still miss about $0.45 out of every $1.00 of unusual gains/losses (hidden and reported) – such as one-time write-downs and gains on sale.
Better Earnings for Valuing the S&P 500
Stock prices are a reflection of earnings estimates. That’s why we see more upside ahead for the stock market.
Analyzing the price-to-earnings (P/E)[1] of the S&P 500 based on New Constructs’ Core Earnings shows how oversold the market was in March and that, despite the recent rebound, the S&P 500 remains very reasonably valued compared to the past few years. See Figure 1 for details.
Figure 1: Price-to-Core vs. Price-to-SPGI’s Operating Earnings for the S&P 500: 2013 – present
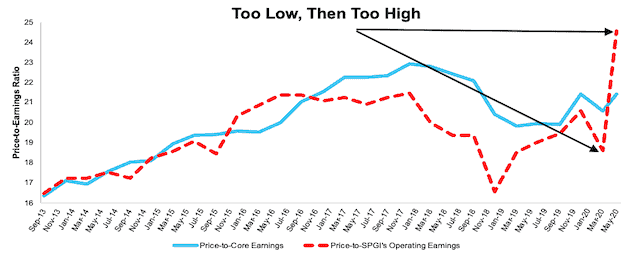
Sources: New Constructs, LLC, company filings, and S&P Global.
P/E ratios are based on four quarters of aggregated S&P 500 constituent results in each period. More details in Appendix.
How You Can Make Money with Our Core Earnings
Passive investing has become a very crowded trade, and now is the best time in many, many years for investors to pick individual stocks, especially those armed with differentiated insight into earnings.
Table 1 lists the stocks that are the most attractive based on strong Core Earnings growth and valuations at historic discounts. Most of these picks have significantly outperformed the S&P 500 and remain undervalued.
We recommend investors consider putting money into these stocks and believe they have even more upside potential than the S&P 500 or any other index.
Table 1: Stock Picks in Today’s Market (with links to reports)
| Company | Ticker | Publish Date | Performance vs S&P 500 (as of 6/23) |
| SYSCO Corporation | SYY | 4/15/20 | 14% |
| Simon Property Group | SPG | 4/20/20 | 19% |
| Darden Restaurants | DRI | 4/22/20 | -2% |
| D.R. Horton | DHI | 4/27/20 | 25% |
| Southwest Airlines | LUV | 5/4/20 | 16% |
| Omnicom Group | OMC | 5/6/20 | -10% |
| Hyatt Hotels | H | 5/14/20 | 4% |
| Allstate Corp | ALL | 5/18/20 | -8% |
| JPMorgan Chase & Company | JPM | 5/21/20 | 2% |
| Caterpillar | CAT | 5/27/20 | 0% |
Sources: New Constructs, LLC
You can find more recent reports like these in our Long Ideas.
This article originally published on July 14, 2020.
Disclosure: David Trainer owns SYY, SPG, DHI, LUV, JPM, and H. David Trainer, Kyle Guske II, and Matt Shuler receive no compensation to write about any specific stock, style, or theme.
Follow us on Twitter, Facebook, LinkedIn, and StockTwits for real-time alerts on all our research.
Appendix I: P/E Ratio Methodology for Core & SPGI’s Operating Earnings
In the analysis above, we calculate the price-to-Core Earnings ratio as follows:
- Calculate a trailing four quarters earnings yield for every S&P 500 constituent
- Weight the earnings yield by each stock’s respective S&P 500 weight
- Sum the weighted earnings yields and take the inverse (1/Earnings Yield)
This method allows us to capture the impact of changes to S&P 500 constituents on a quarterly basis. For example, a company could be a constituent in 2Q18, but not in 3Q18. This method captures the continuously changing nature of the S&P 500 constituency.
We use the earnings yield methodology because P/E ratios don’t follow a linear trend. A P/E ratio of 1 is “better” than a P/E ratio of 30, but a P/E ratio of 30 is “better” than a P/E ratio of -15. In other words, aggregating P/E ratios can result in a low multiple due the inclusion of just a few stocks with negative P/Es.
Using earnings yields solves this problem because a high earnings yield is always “better” than a low earnings yield. There is no conceptual difference when flipping from positive to negative earnings yields as there is with traditional P/E ratios.
For all periods in the above analysis, we calculate the price-to-SPGI’s Operating Earnings ratio by summing the preceding 4 quarters of Operating Earnings per share and, then, dividing by the S&P 500 price at the end of each measurement period.
Figures I and II show the price-to-Core Earnings ratio using TTM data for the companies in the S&P 500. Price-to-SPGI’s operating earnings are always calculated in the manner defined above because we do not have access to TTM Operating Earnings data for S&P 500 constituents. In these Figures, we calculate the price-to-Core Earnings ratio as follows:
- Calculate a TTM earnings yield for every S&P 500 constituent
- Weight the earnings yields by each stock’s respective S&P 500 weight
- Sum the weighted earnings yields and take the inverse (1/Earnings Yield)
Figure I: Price-to-Core vs. Price-to-SPGI’s Operating Earnings: TTM 9/30/13 – present
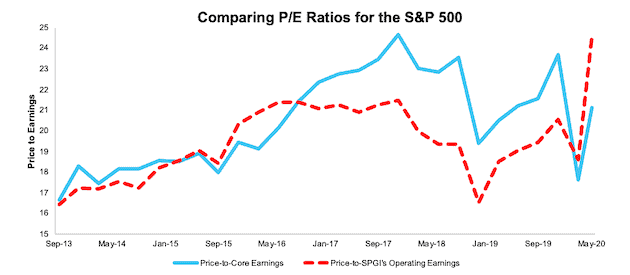
Sources: New Constructs, LLC, company filings, and S&P Global.
Note that the Core Earnings P/E ratio is aggregating the TTM results for constituents in each period.
Figure II: Price-to-Core vs. Price-to-SPGI’s Operating Earnings: TTM 10 Quarter Average
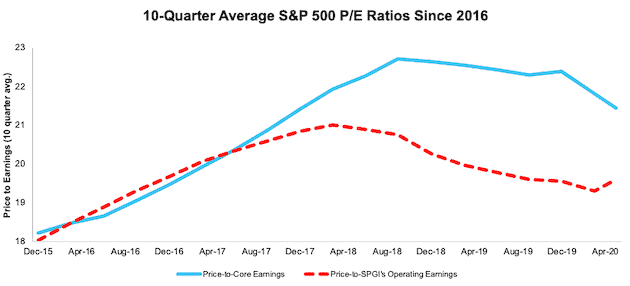
Sources: New Constructs, LLC, company filings, and S&P Global.
Note that the Core Earnings P/E ratio is aggregating the TTM results for constituents in each period.
Figure III compares the price-to-Core Earnings and price-to-SPGI’s Operating Earnings ratios dating back to 2004. SPGI’s Operating Earnings suggest the S&P 500 is more highly valued than it has been since the Financial Crisis.
Figure III: Price-to-Core vs. Price-to-SPGI’s Operating Earnings: Since 2004
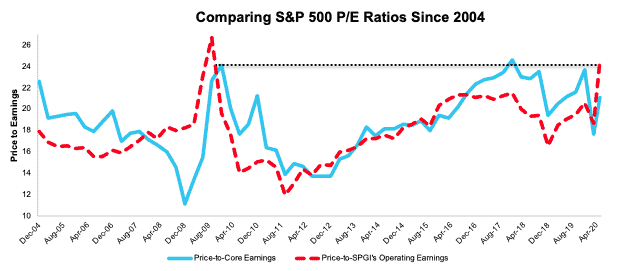
Sources: New Constructs, LLC, company filings, and S&P Global.
Note that the SPGI P/E is based on four quarters of aggregated S&P 500 results in each period. Core Earnings P/E is based on annual data.
[1] The methodology for calculating an apples-to-apples price-to-Core Earnings and price-to-SPGI’s Operating Earnings is in Appendix I.