We published an update on this Long Idea on April 21, 2021. A copy of the associated Earnings Update report is here.
Fears that the economic slowdown will permanently and drastically reduce advertising spend lead investors to overlook this highly profitable industry leader. We suggest investors look past the current economic downturn and set their sights on the opportunity that awaits this best-in-class business when the economy recovers. Omnicom Group, Inc. (OMC: $54/share) is this week’s Long Idea.
Don’t Throw the Baby Out with the Bathwater
We first made OMC a Long Idea in May 2018 and it has since underperformed the market (down 27% vs S&P 500 up 6%). We noted at the time of our report that OMC’s list of loyal clients, many of whom had been with the firm for decades, and its leading profitability positioned the firm to capitalize on industry growth.
With an even cheaper valuation, OMC looks even more attractive today. Before COVID-19, advertising and marketing firms were increasing their growth forecasts for 2020. While those forecasts have certainly changed in the short term, businesses will still need to manage their brands and attract customers, both during and after the crisis. Longer term, we believe there will be pent up demand for advertising, public relations, and brand building, even if some business operations are different in a post COVID-19 world.
OMC’s History of Profit Growth
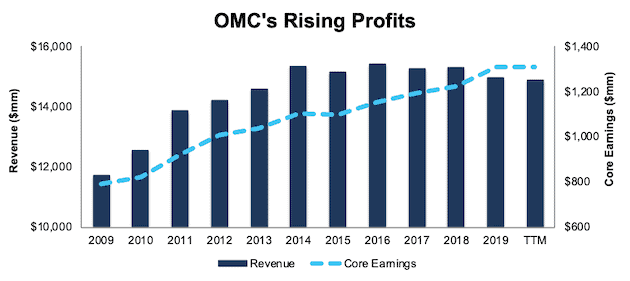
OMC has a strong history of profit growth. Over the past decade, OMC has grown revenue by 2% compounded annually and core earnings[1] by 5% compounded annually, per Figure 1. Longer term, OMC has grown core earnings by 7% compounded annually over the past two decades. The firm increased its core earnings margin from 7% in 2009 to 9% in the TTM period.
Figure 1: OMC’s Core Earnings & Revenue Growth Since 2009
Sources: New Constructs, LLC and company filings.
OMC’s rising profitability helps the business generate significant free cash flow (FCF). The company generated positive FCF in each of the past ten years and a cumulative $8 billion (61% of market cap) over the past five years. OMC’s $1.1 billion in FCF over the TTM period equates to a 6% FCF yield, which is significantly higher than the Consumer Cyclicals sector average of 1%.
Omnicom’s Balance Sheet Provides Ample Liquidity to Survive the Crisis
Companies with strong cash balances are better positioned to survive macro-economic uncertainty. OMC has the cash to survive the current disruption to operations, with $2.7 billion in cash and equivalents on its balance sheet at the end of 1Q20. Additionally, the firm has a $2.5 billion revolving credit facility and recently announced a $600 million senior note offering and an additional $400 million revolving credit agreement. This capital, along with cash on hand at the end of March 2020, gives the firm over $6 billion of liquidity with no notes maturing until May 2022.
According to OMC’s latest quarterly filing, the firm spent $3 billion ($1 billion/month) on operating expenses in 1Q20. In a worst-case scenario where OMC generates no revenue, and continues to cover its full operating expenses, OMC could operate for over six months before needing additional capital.
However, it is very unlikely that OMC’s revenue will ever go to zero since the firm recently stated that it was preparing for a “double digit” decline in the second quarter of 2020, not a complete shutdown of its operations. Additionally, 83% of OMC’s operating expenses in 1Q20 were salary and service costs, which the firm is reducing through furloughs and layoffs. Should a worst-case scenario emerge, OMC would be able to further cut expenses and prolong its survival.
OMC’s Profitability Ranks Highest Among Competitors
OMC’s profitability was trending higher at a faster pace than its competitors before the crisis. In our initial report, we mentioned how OMC’s high client-retention rate creates a competitive advantage for the firm, which continues today. With leading profitability, consistent cash flows, and a strong balance sheet, OMC can not only survive the downturn, but continue to thrive once the economy recovers.
OMC’s invested capital turns, have remained at 1.3 from 2015 to the TTM period, which is well above the market-cap-weighted average of peers, which sits at 0.8. The peer group in this analysis includes the 20 Advertising and Marketing firms under coverage, including Interpublic Group of Companies (IPG), WPP, PLC (WPP), Nielsen Holdings (NLSN), and Clear Channel Outdoor Holdings (CCO) among others.
OMC’s net operating profit after-tax (NOPAT) margin, while lower than the market-cap-weighted peer average, has increased ~200 basis points from 9% in 2015 to 11% TTM. Meanwhile, the market-cap-weighted average NOPAT margin of peers has increased by just 30 basis points, from 11.5% to 11.8% over the same time.
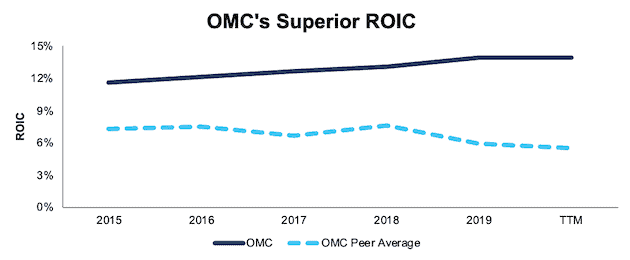
The combination of rising margins and steady invested capital turns drives OMC’s ROIC higher. OMC has improved its ROIC from 12% in 2015 to 14% TTM. Per Figure 2, the market-cap-weighted average ROIC of OMC’s peers has declined from 7% to 6% over the same time.
Figure 2: OMC’s ROIC vs. Competitors
Sources: New Constructs, LLC and company filings.
Omnicom’s Opportunity After the Dip
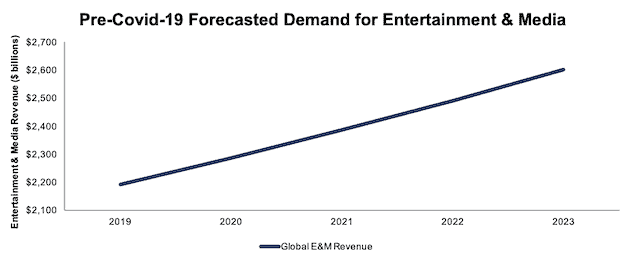
Before the COVID-19 pandemic, PricewaterhouseCoopers projected the Global Entertainment & Media (E&M) industry, which includes internet and TV advertising, to grow by 4.3% compounded annually through 2023. Figure 3 illustrates the projected industry growth, from $2.1 trillion in 2018 to $2.6 trillion in 2023. Once economic activity rebounds, we expect advertising spending to resume the growth trajectory forecasted before the crisis.
Figure 3: Pre-Covid-19 Global E&M Revenue Forecast
Sources: New Constructs, LLC and PWC Global Entertainment & Media Outlook 2019-2023.
While the COVID-19 pandemic will cause advertising spend to drop significantly in 2020, the International Monetary Fund (IMF) and nearly every economist in the world believe the global economy (which would include advertising) will grow strongly in 2021. In fact, Alphabet (GOOGL) and Facebook (FB) each recently reported that advertising revenue seemed to stabilize in April, which could indicate ad spending is already on the rebound.
It is believed that Henry Ford once said, “the man who stops advertising to save money is like the man who stops the clock to save time.” Though the present dip in economic activity will tempt many businesses to reduce their spending on advertising, they will soon find out that they can’t “stop time”.
In other words, while marketing and advertising appear to be discretionary expenses in the short term, they, along with public relations strategies, are essential to the operations for nearly all businesses over the long term. Economic downturns can present unique opportunities for companies that remain committed to advertising spend. Once businesses get beyond immediate cash concerns, firms will seize the opportunity to market and advertise to consumers with pent up demand. OMC is well-positioned to provide these clients with content creation, ad placement, and more as the economy moves past the initial shock of the COVID-19 pandemic.
OMC Trades at Cheapest Level in History of Our Model
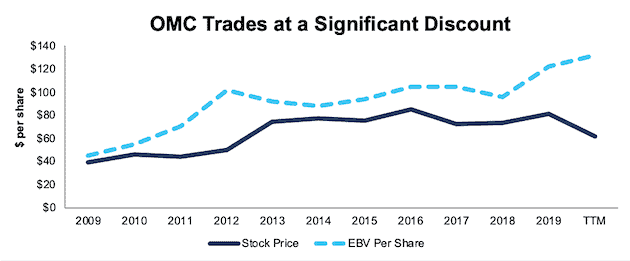
After falling 32% YTD to $54/share, OMC now trades at its cheapest PEBV (0.4) in the history of our model. This ratio means the market expects OMC’s NOPAT to permanently decline by 60%. This expectation seems overly pessimistic over the long term.
OMC’s current economic book value, or no-growth value, is $130/share – a 140% upside to the current price.
Figure 4: OMC’s Stock Price vs. Economic Book Value (EBV)
Sources: New Constructs, LLC and company filings.
OMC’s Current Price Implies Doomsday Scenario
Below, we use our reverse DCF model to quantify the cash flow expectations baked into OMC’s current stock price. Then, we analyze the implied value of the stock based on different assumptions about COVID-19’s impact on the advertising and marketing industry and OMC’s future growth in cash flows.
Scenario 1: Using historical revenue declines and margins, as well as average historical GDP growth rates, we can model the worst-case scenario already implied by OMC’s current stock price. In this scenario, we assume:
- NOPAT margins fall to 8% (all-time company low in 2001) in 2020-2022 before rebounding to 9% (10-year average) in 2023 and each year thereafter
- Revenue falls 26% in 2020, (double the YoY decline from 2008 to 2009) and 13% in 2021 and 2022
- Sales begin growing again in 2023, but only at 3.5% a year, which equals the average global GDP growth rate since 1961
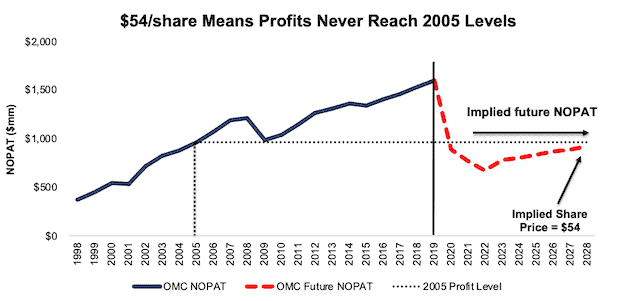
In this scenario, where OMC’s NOPAT declines 25% compounded annually from 2019 to 2022 and 6% compounded annually over nine years, the stock is worth $54/share today – nearly equal to the current stock price. This scenario also accounts for the debt issuance since the end of 1Q20 noted earlier. We conservatively assume this capital will be used to cover operating expenses and do not treat it as excess cash. See the math behind this reverse DCF scenario.
For reference, OMC’s NOPAT declined by 2% compounded annually from 2008 to 2011 before growing by 4% compounded annually the next eight years.
Figure 5 compares the stock’s implied future NOPAT to the firm’s historical NOPAT in this scenario. This worst-case scenario implies OMC’s NOPAT nine years from now will be 61% below its 2019 NOPAT. In other words, this scenario implies that nine years after the COVID-19 pandemic, OMC’s profits will have only recovered to 2004-2005 levels. In any scenario better than this one, OMC holds significant upside potential, as we’ll show below.
Figure 5: Current Valuation Implies Severe, Long-Term Decline in Profits: Scenario 1
Sources: New Constructs, LLC and company filings.
Scenario 2: Big Upside Without a Full Recovery
If we assume, as does the IMF and nearly every economist in the world, that the global economy grows strongly in 2021, OMC looks even more undervalued.
In this scenario, we assume:
- NOPAT margins fall to 8% (all-time company low) in 2020 and rebound to 9% (all-time company average) in 2021 and each year thereafter
- Revenue falls 26% in 2020 – twice the year-over-year revenue decline from 2008 to 2009
- Revenue growth returns in 2021 at the IMF’s global base-case GDP growth rate of 5.8%
- Revenue grows at 3.5% a year thereafter, which equals the average global GDP growth rate since 1961
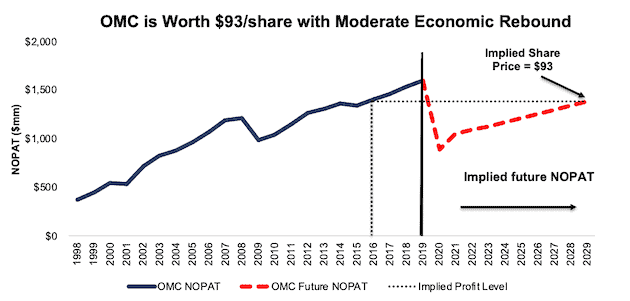
In this scenario, OMC’s NOPAT falls 45% in 2020 and declines by 1% compounded annually over the next decade, and the stock is worth $93/share today – a 72% upside to the current price. This scenario also accounts for the debt issuance since the end of 1Q20 noted earlier. We conservatively assume this capital will be used to cover operating expenses and do not treat it as excess cash. See the math behind this reverse DCF scenario.
For comparison, OMC has grown NOPAT by 5% compounded annually over the past decade and 7% compounded annually over the past two decades. It’s not often investors get the opportunity to buy an industry leader at such a discounted price. There’s upside to $93/share as well given that it implies that profits only rebound to 2015-16 levels.
Figure 6 compares the stock’s implied future NOPAT to the firm’s historical NOPAT in scenario 2.
Figure 6: Implied Profits with Moderate Global Recovery: Scenario 2
Sources: New Constructs, LLC and company filings.
Sustainable Competitive Advantages Will Drive Shareholder Value Creation
Here’s a summary of why we think the moat around OMC’s business will enable it to continue to generate higher NOPAT than the current market valuation implies. The following competitive advantages help OMC survive the downturn and return to growth as the economy grows again:
- Ample liquidity to survive the dip
- Loyal clientele with multi-year relationships
- Superior profitability to peers
What Noise Traders Miss with OMC
These days, fewer investors focus on finding quality capital allocators with shareholder friendly corporate governance. Instead, due to the proliferation of noise traders, the focus is on short-term technical trading trends while high-quality fundamental research is overlooked. Here’s a quick summary of what noise traders are missing:
- Consistent core earnings growth over the past decade
- Long-term demand for marketing and advertising
- Valuation implies the marketing and advertising industry never recovers from COVID-19
Executive Compensation Plan Could Be Improved
OMC’s incentive awards include a short-term cash portion and long-term equity portion paid in restricted stock units. The awards are tied to meeting target EPS growth, EBITA margin, organic growth, return on equity, operating profit margin, and organic growth plus operating profit margin goals.
We would prefer OMC tie performance compensation to improvement in ROIC, as there is a strong correlation between improving ROIC and increasing shareholder value. Tying executive compensation to ROIC also ensures that executives’ interests are properly aligned with shareholders’ interests.
Despite using flawed metrics for measuring performance, OMC’s plan has not compensated executives while destroying shareholder value. OMC grew economic earnings by 8% compounded annually over the past decade.
Dividend Provides Nearly 5% Yield
OMC increased its dividend in eight of the last 10 years and has grown its annual dividend by 7% compounded annually since 2015. OMC’s present annualized dividend of $2.60/share provides a 4.8% yield. In its 1Q20 earnings call, management noted the firm has “no plans to change” its dividend policy. Best of all, in the past five years, OMC generated far more in free cash flow ($8.0 billion) than it has paid out in dividends ($3.2 billion), or an average $959 million surplus each year.
In addition to dividends, OMC regularly returned capital to shareholders through share repurchases. However, the firm chose to suspend its repurchase program to strengthen its liquidity position for the present crisis. Before the suspension, OMC repurchased $200 million worth of shares in the first quarter of 2020. In 2019, the firm repurchased $610 million worth of shares. Should the firm resume share repurchases once the crisis is over, the yield for investors will only increase.
A Consensus Beat or Signs of Recovery Could Send Shares Higher
According to Zacks, consensus estimates at the end of February pegged OMC’s 2020 EPS at $6.43/share. Jump forward to May 4, and consensus estimates for OMC’s 2020 EPS have fallen to $4.41/share.
Though the COVID shutdowns are crushing near-term profits, these lowered expectations provide a great opportunity for a strong business, such as OMC, to beat consensus, if not this quarter, then maybe the next. Though our current Earnings Distortion Score for OMC is “In-Line”, OMC beat EPS estimates in each of the past 12 quarters, and doing so again, in the midst of such market turmoil, could send shares higher.
Additionally, any signs of the anticipated recovery in advertising spending this year would send shares higher.
Insider Trading and Short Interest Trends
Over the past three months, insiders have bought a total of 84 thousand shares and sold three thousand shares for a net effect of 81 thousand shares purchased. These purchases represent less than 1% of shares outstanding.
There are currently 21 million shares sold short, which equates to 10% of shares outstanding and nearly 8 days to cover. Short interest is up 4% from the prior month. The high short interest increases the chances of a short squeeze should OMC report good guidance and/or an earnings beat.
Critical Details Found in Financial Filings by Our Robo-Analyst Technology
As investors focus more on fundamental research, research automation technology is needed to analyze all the critical financial details in financial filings as shown in the Harvard Business School and MIT Sloan paper, "Core Earnings: New Data and Evidence”.
Below are specifics on the adjustments we make based on Robo-Analyst findings in Omnicom Group’s 2019 10-K:
Income Statement: we made $577 million of adjustments with a net effect of removing $257 million in non-operating expenses (2% of revenue). See all adjustments made to OMC’s income statement here.
Balance Sheet: we made $7.3 billion of adjustments to calculate invested capital with a net increase of $9 million. One of the most notable adjustments was $1.2 billion (11% of reported net assets) in goodwill. See all adjustments to OMC’s balance sheet here.
Valuation: we made $10.1 billion of adjustments with a net effect of decreasing shareholder value by $6.2 billion. Apart from total debt, the most notable adjustment to shareholder value was $2.3 billion in minority interests. This adjustment represents 6% of OMC’s market cap. See all adjustments to OMC’s valuation here.
Attractive Funds That Hold OMC
The following funds receive our Attractive-or-better rating and allocate significantly to Omnicom Group.
- Brown Advisory – Beutel Goodman Large Cap Value Fund (BVALX) – 5.2% allocation and Attractive rating.
- FMI Large Cap Fund (FMIQX) – 3.4% allocation and Attractive rating.
- Jensen Quality Value Fund (JNVYX) – 3.2% allocation and Attractive rating.
- Alpha Architect U.S. Quantitative Value ETF (QVAL) – 2.7% allocation and Attractive rating.
- WisdomTree Dynamic Long/Short U.S. Equity Fund (DYLS) – 2.6% allocation and Attractive rating.
- AIG ESG Dividend Fund (EDFWX) – 2.5% allocation and Attractive rating.
- Arrow QVM Equity Factor ETF (QVM) – 2.2% allocation and Very Attractive rating.
This article originally published on May 6, 2020.
Disclosure: David Trainer, Kyle Guske II, and Matt Shuler receive no compensation to write about any specific stock, style, or theme.
Follow us on Twitter, Facebook, LinkedIn, and StockTwits for real-time alerts on all our research.
[1] Our core earnings are a superior measure of profits, as demonstrated in In Core Earnings: New Data & Evidence a paper by professors at Harvard Business School (HBS) & MIT Sloan. The paper empirically shows that our data is superior to “Income Before Special Items” from Compustat, owned by S&P Global (SPGI).
