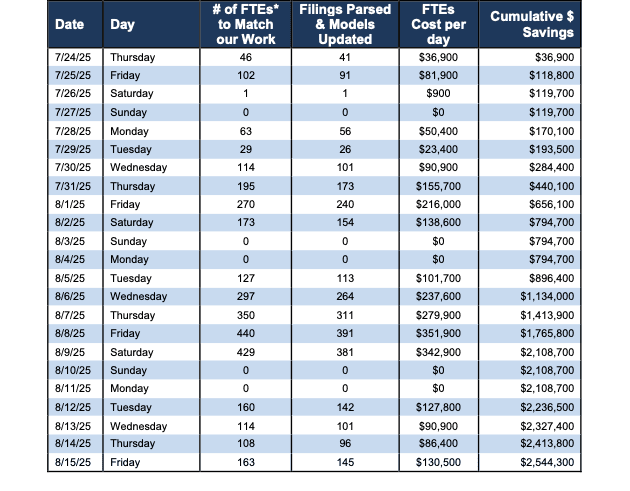
During 2Q25 footnotes season, we parsed 2,827 10Q and 10K filings and created $2,544,500[1] of value for clients. See details in Figure 1.
These filings tend to come in large bunches during what we call Footnotes Season. The 2Q25 Footnotes Season is mostly 10-Qs for second quarter earnings from companies with 12/31 fiscal year ends.
Footnotes Seasons give our Robo-Analyst AI-driven technology[2] an opportunity to shine as it enables us to produce proven-superior research with unrivaled speed and scale.
Figure 1: Putting a $ Value on Our Parsing Work for Clients: 2Q25 Footnotes Season
Sources: New Constructs, LLC
* FTEs = Full Time Employees at $100/hour for 8 hours a day.
Indeed, the cost of replicating the research we deliver would cost our clients multiples more time and money than what we charge.
The savings in Figure 1 are likely very conservative estimates because they do not account for the cost of any management or training of analysts. Nor, do they account for the cost of building the financial models and data taxonomies we use to transform the data into alpha-generating signals.
It is clear that we create tremendous value for all of our clients, from Stock Tracker 50 to Professional and Institutional members.
Want access to our superior fundamental research? Start your membership today.
Proprietary Footnotes Season Data Drives Alpha
While we’re explaining the diligence required to gather and organize superior fundamental data, we want to show you how our research delivers alpha. We’ve developed multiple indices with Bloomberg’s Index Licensing Group. All three outperform the S&P 500. See Figures 2-4.
- Bloomberg New Constructs Core Earnings Leaders Index (ticker: BCORET:IND)
- Bloomberg New Constructs Ratings VA-1 Index (ticker: BNCVA1T:IND)
- Bloomberg New Constructs 500 Index (ticker: B500NCT:IND)
The Bloomberg New Constructs Core Earnings Leaders Index, which allocates based on Earnings Capture and Core Earnings, beat the S&P 500 by over 42% over the past five years. The Index (ticker: BCORET:IND) was up 131% while the S&P 500 was up 90%.
Figure 2: Bloomberg New Constructs Core Earnings Leaders Index Outperforms S&P 500: Last 5 Years
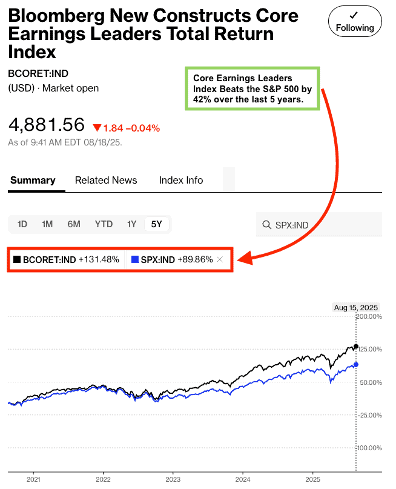
Sources: Bloomberg as of August 15, 2025
Note: Past performance is no guarantee of future results.
The “Very Attractive Stocks” Index, which allocates to stocks that get a Very Attractive rating by our AI Agent for Investing, beat the S&P 500 by 73% over the last five years. Bloomberg’s official name for the index is Bloomberg New Constructs Ratings VA-1Index (ticker: BNCVAT1T:IND). Figure 3 shows it was up 163% while the S&P 500 was up 90%.
Figure 3: Very Attractive-Rated Stocks Strongly Outperform the S&P 500: Last Five Years
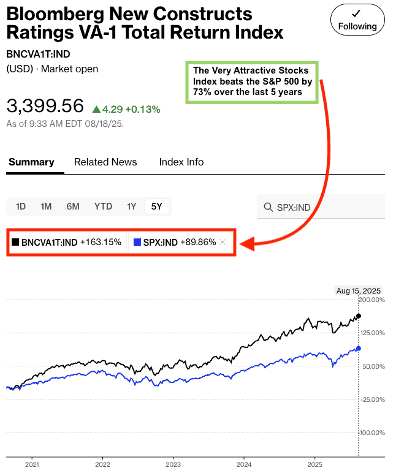
Sources: Bloomberg as of August 15, 2025
Note: Past performance is no guarantee of future results.
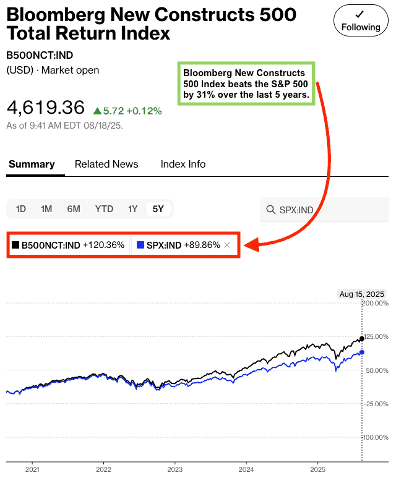
Our “Core-Earnings Weighted S&P 500” Index, which weights the largest 500 U.S. companies by Core Earnings instead of market cap, beat the S&P 500 by 31% over the past five years. Bloomberg’s official name for the index is Bloomberg New Constructs 500 Total Return Index (ticker: B500NCT:IND). Figure 4 shows it was up 120% while the S&P 500 was up 90%.
Figure 4: Bloomberg New Constructs 500 Index Strongly Outperforms the S&P 500: Last Five Years
Sources: Bloomberg as of August 15, 2025
Note: Past performance is no guarantee of future results.
This article was originally published on August 21, 2025.
Disclosure: David Trainer, Kyle Guske II, and Hakan Salt, receive no compensation to write about any specific stock, sector, style, or theme.
Questions on this report or others? Join our online community and connect with us directly.
[1] Cumulative savings is calculated assuming it takes nine hours per filing and a full-time employee making $100/hour to parse each.
[2] Harvard Business School features the powerful impact of our research automation technology in New Constructs: Disrupting Fundamental Analysis with Robo-Analysts.