
Wall Street analysts are too bullish on second quarter earnings expectations for some of the market’s hottest companies, including Alphabet (GOOGL), Amazon (AMZN) and PayPal Holdings (PYPL), which are likely to fall short of bloated consensus earnings estimates.
Alphabet (GOOGL), Amazon (AMZN) and PayPal (PYPL) maintain investments in public and private companies that are not necessarily core to their businesses, which distort the company’s earnings and Wall Street’s earning expectations. As valuations for stocks like Alphabet, Amazon, and PayPal rise, it’s important for investors to truly understand the financials of these companies.
A public company’s investments in other private and public companies can artificially boost its overall profits during a bull market when asset values are rising across the board, but these investments can pose hidden risks to company earnings during times of market volatility.
In theory, Wall Street analysts adjust earnings estimates for non-core investments that distort corporate earnings per share, but in reality, they don’t. Without adjusting for these items, investors don’t get an accurate picture of a company’s true profits. Investors deserve to know if they can trust the earnings and estimates of the companies they hold, especially as we get deeper into an aging bull market.
This report provides unprecedented insights into which companies are most likely to miss their consensus earnings estimates based on our proprietary Core Earnings research[1]. Get our report on S&P 500 Companies Likely to Beat Wall Street’s 2Q21 EPS Estimates” here.
Consensus Earnings Estimates Are Overstated by >10% for 47% of Companies
In S&P 500 Companies With the Most Misleading Consensus Earnings Estimates, we show the record earnings beats for 1Q21 are misleading. Per Figure 1, 47% of S&P 500 companies have overstated their EPS compared to our Core EPS by more than 10% and about 12% of S&P 500 companies have understated their EPS by more than 10%. When companies overstate EPS, they do so by an average of 31%. When they understate EPS, they do so by an average of 55% over the trailing twelve months (TTM) ended 1Q21[2].
Figure 1: S&P 500 Street Distortion Details
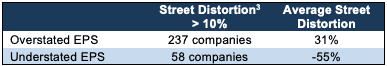
Sources: New Constructs, LLC and company filings.
We expect companies to continue overstating EPS in 2Q21 as they take advantage of the post-Covid-19 euphoria to boost and overstate their EPS by sneaking unusual gains into their results.
This report aims to provide more reliable fundamental research for analyzing consensus earnings estimates, especially companies whose consensus earnings estimates are most overstated.
Three S&P 500 Companies Likely to Miss Calendar 2Q21 Earnings
Figure 2 shows three S&P 500 companies likely to miss calendar 2Q21 earnings based on overstated consensus earnings estimates. Below we detail the hidden and reported unusual items that created Street Distortion, and overstated consensus earnings estimates, over the TTM for Amazon, Alphabet and PayPal.
Figure 2: Three S&P 500 Companies Likely to Miss 2Q21 EPS Estimates
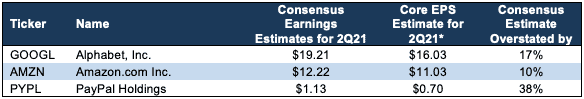
Sources: New Constructs, LLC and company filings.
*Assumes Street Distortion as a percent of Core EPS is same for 2Q21 EPS as for 1Q21 TTM EPS.
What Causes Street Distortion
Many investors know that Generally Accepted Accounting Principles (GAAP) contain numerous loopholes that allow companies to manipulate financial statement disclosures. Fewer investors are aware of how much unusual gains and losses, i.e. unusual items, distort consensus earnings estimates and SPGI’s Operating Earnings.
Many investors assume consensus earnings estimates properly adjust for unusual items, but they do not.
This report details the hidden and reported unusual items missed by consensus earnings estimates, which can create overstated earnings and a greater likelihood of missing earnings expectations. Professors from Harvard Business School and MIT Sloan published similar research in The Journal of Financial Economics, which concludes:
“Street Earnings adjustments are not necessarily complete or comparable across firms."
(Page 16, 3rd paragraph)
Alphabet’s Earnings Estimates
Wall Street expects Alphabet to earn $19.21 per share for the second quarter, which is based on artificially high historical consensus earnings, which include billions of dollars in gains from Alphabet’s investments in other public and private companies, which are not related to its core business.
Alphabet’s 2Q21 consensus earnings estimate of $19.21/share is overstated by $3.18 per share. Our Core EPS estimate is $16.03, and the overstated estimates increase the likelihood that Alphabet’s EPS will miss Wall Street analysts’ expectations in its calendar 2Q21 earnings report.
As we show below, $7.6 billion in net gains on investments in public and privately held companies, not Alphabet’s core business operations, materially distort Alphabet’s 1Q21 TTM consensus earnings and GAAP Earnings. When we adjust for all unusual items, we find that Alphabet’s 1Q21 TTM Core EPS are $62.67, which is well below 1Q21 TTM consensus earnings per share of $75.12 and 1Q21 TTM GAAP EPS of $75.04.
Figure 3: Comparing Alphabet’s Core, Street, and GAAP Earnings: TTM as of 1Q21
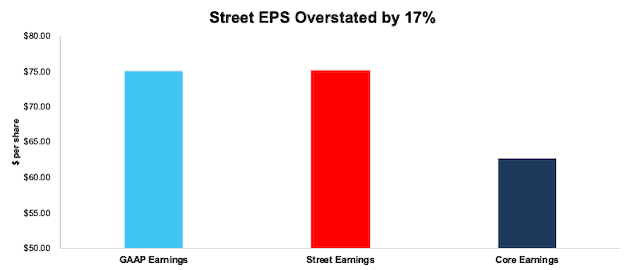
Sources: New Constructs, LLC and company filings.
Below, we reconcile the differences between Alphabet’s 1Q21 TTM Core Earnings and GAAP Earnings so readers can audit our work. We cannot reconcile Core Earnings to consensus earnings estimates because we do not have the details as to exactly what makes consensus earnings estimates differ from GAAP Earnings.
Figure 4: Alphabet GAAP Earnings to Core Earnings Reconciliation: TTM
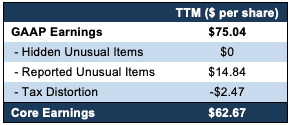
Sources: New Constructs, LLC and company filings.
The majority, $8.63/share, of the unusual income that consensus earnings estimates fail to capture is very clearly non-core and appears below the “Income From Operations” line of Alphabet’s income statement in both the 1Q21 10-Q and 2020 10-K.
Reported Unusual Gains, Net = $10.2 billion or $14.84/per share
- Each of the following is included in other income (expense) on the income statement. We found these details in the footnotes:
- $7.6 billion gain on debt & equity securities in the TTM period, based on
- $1.5 billion gain on equity securities in 2Q20
- $387 million gain on debt securities in 2Q20
- $1.9 billion gain on equity securities in 3Q20
- $116 million gain on debt securities in 3Q20
- $991 million loss on equity and debt securities in 4Q20
- $4.8 billion gain on equity securities in 1Q21
- $86 million loss on debt securities in 1Q21
- -$1.3 billion in performance fees in the TTM period, based on
- $75 million in 2Q20
- $135 million in 3Q20
- $405 million in 4Q20
- $665 million in 1Q21
- -$282 million in Other Expense (income) in the TTM period, based on
- $147 million expense in 2Q20
- $88 million expense in 3Q20
- $420 million expense in 4Q20
- $373 million income in 1Q21
- o -$150 million in foreign currency exchange losses in the TTM period, based on
- $92 million loss in 2Q20
- $84 million loss in 3Q20
- $87 million loss in 4Q20
- $113 million gain in 1Q21
- $4.3 billion or $6.28/per share in the TTM period based on a $4.3 billion unrealized gain on equity securities – 2020 10-K
Tax Distortion = -$1.7 billion or -$2.47/per share
- We remove the tax impact of unusual items on reported taxes when we calculate Core Earnings. It is important that taxes get adjusted so they are appropriate for adjusted pre-tax earnings.
Despite the likelihood that Alphabet’s earnings fall short of Wall Street estimates for the second quarter, the stock is still attractive. While the short-term may be a volatile ride for investors if Alphabet misses expectations, we believe risk/reward dynamic is favorable over the long-term due to Alphabet’s strong cash generation and significant market share in the digital advertising space.
Amazon’s Earnings Estimates
Wall Street expects Amazon to earn $12.22 per share for the second quarter, but those estimates are based on recent consensus earnings that include billions of dollars of ‘other income’ and gains from its investments in private companies. These items, which are not core to its business, increase consensus earnings estimates, which create a higher bar for the company to meet when it reports earnings.
Amazon’s 2Q21 consensus earnings estimates estimate of $12.22/share is overstated by $1.19 per share. Our Core EPS estimate is $11.03.
Amazon’s $2.9 billion in Other Income, along with $1.5 billion in equity investments in private companies materially distort Amazon’s 1Q21 TTM consensus earnings and artificially boost profitability. When we adjust for all unusual items, we find that Amazon’s 1Q21 TTM Core EPS are $47.44, which is well below 1Q21 TTM consensus earnings per share of $52.55 and 1Q21 TTM GAAP EPS of $52.57.
Figure 5: Comparing Amazon’s Core, Street, and GAAP Earnings: TTM as of 1Q21
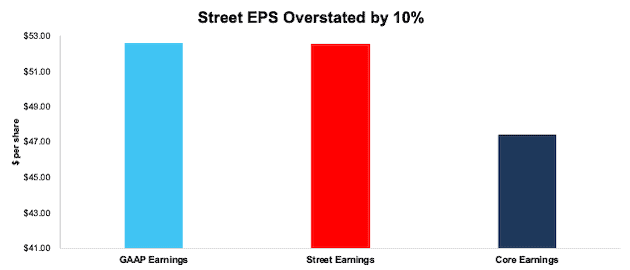
Sources: New Constructs, LLC and company filings.
Below, we reconcile the differences between Amazon’s 1Q21 TTM Core Earnings and GAAP Earnings so readers can audit our work. We cannot reconcile Core Earnings to consensus earnings estimates because we do not have the details as to exactly what makes consensus earnings estimates differ from GAAP Earnings.
Figure 6: Amazon GAAP Earnings to Core Earnings Reconciliation: 1Q21 TTM
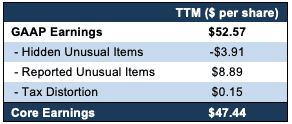
Sources: New Constructs, LLC and company filings.
Hidden Unusual Expenses, Net = -$2.0 million or -$3.91/per share
- -$2.0 billion in COVID-19 related costs – Page 23 1Q21 10-Q
Reported Unusual Gains, Net = $4.5 billion or $8.89/per share
- $2.9 billion in Other Income in the TTM period, based on
- $646 million income in 2Q20
- $925 million income in 3Q20
- $1.3 billion income in 4Q20
- $24 million income in 1Q21
- $1.5 billion upward adjustment relating to equity investments in private companies – 1Q21 10-Q
- $305 million equity warrant valuation gains – 1Q21 10-Q
- -$31 million in foreign currency losses – 1Q21 10-Q
- -$76 million in marketable equity securities valuation losses – 1Q21 10-Q
Tax Distortion = $78 million or $0.15/per share
- We remove the tax impact of unusual items on reported taxes when we calculate Core Earnings. It is important that taxes get adjusted so they are appropriate for adjusted pre-tax earnings.
We believe there is little upside in Amazon’s stock. While Amazon has strong businesses, the company is spending money to maintain its e-commerce growth and we believe any cloud computing tailwinds are fully priced into the stock.
PayPal’s Earnings Expectations
Wall Street expects PayPal’s to earn $1.13 per share for the second quarter of 2021, but these estimates are overstated and based off of prior historical earnings data that includes billions of dollars worth of gains in what the company calls strategic investments, or stakes in publicly and privately held companies.
PayPal’s 2Q21 consensus earnings estimate of $1.13 per share is overstated by $0.43 per share. Our Core EPS estimate is $0.70, and the overstated consensus earnings estimates increase the likelihood that PayPal’s EPS will miss Wall Street analysts’ expectations in its calendar 2Q21 earnings report.
$1.9 billion in gains on investments in public and private businesses materially distort PayPal’s 1Q21 TTM consensus earnings and GAAP earnings and artificially boost profitability. When we adjust for all unusual items, we find that PayPal’s 1Q21 TTM Core EPS are $2.75, which is well below 1Q21 TTM consensus earnings of $4.44 per share and 1Q21 TTM GAAP EPS of $4.39.
Figure 7: Comparing PayPal’s Core, Street, and GAAP Earnings: TTM as of 1Q21
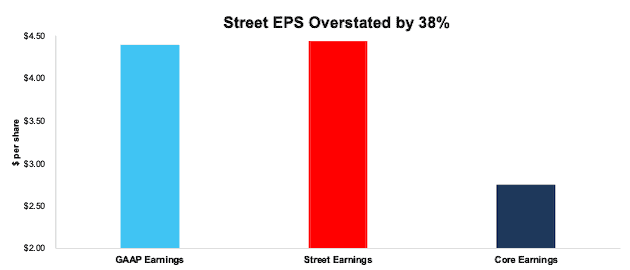
Sources: New Constructs, LLC and company filings.
Below, we detail the differences between PayPal’s 1Q21 TTM Core Earnings and GAAP Earnings so readers can audit our work.
Figure 8: PayPal GAAP Earnings to Core Earnings Reconciliation: 1Q21 TTM
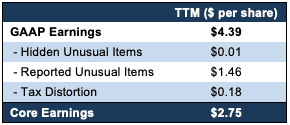
Sources: New Constructs, LLC and company filings.
Hidden Unusual Gains, Net = $7 million or $0.01/per share
- $7 million in sublease income in the TTM period , based on
- $1 million in 2Q20
- $2 million in 3Q20
- $2 million in 4Q20
- $2 million in 1Q21
Reported Unusual Gains, Net = $1.7 billion or $1.46/per share
- $1.9 billion in net gains on strategic investments in the TTM period, based on
- $888 million gain in 2Q20
- $209 million gain in 3Q20
- $941 million gain in 4Q20
- -$120 million loss in 1Q21
- -$168 million in restructuring and other charges in the TTM period, based on
- -$47 million in 2Q20
- -$19 million in 3Q20
- -$44 million in 4Q20
- -$58 million in 1Q21
- -$17 million in Other Expense in the TTM period, based on
- -$7 million in 2Q20
- -$1 million in 3Q20
- -$2 million in 4Q20
- -$7 million in 1Q21
Tax Distortion = $212 million or $0.18/per share
- We remove the tax impact of unusual items on reported taxes when we calculate Core Earnings. It is important that taxes get adjusted so they are appropriate for adjusted pre-tax earnings.
We believe PayPal is a good company, but its stock is expensive. PayPal’s valuation is ahead of the company’s fundamentals and already prices in tailwinds of increased online transactions and potential revenue growth due to rising interest in cryptocurrency trading.
Conclusion: Core Earnings Are More Reliable
As demonstrated above, Core Earnings do a better job of excluding unusual gains and losses and provide a more reliable earnings measure. All Core Earnings adjustments to GAAP Earnings are 100% transparent; so users can audit and trust the research.
A lack of transparency into exactly what makes up consensus earnings and SPGI’s Operating Earnings undermines investors’ ability to analyze profitability. In theory, the differences between Core Earnings and GAAP Earnings should be captured in consensus earnings and SPGI’s Operating Earnings. In theory, they adjust GAAP Earnings for both reported and hidden unusual items. In reality, they do not consistently adjust for unusual items.
For many investors, especially quants, the lack of consistency in what consensus earnings and SPGI’s Operating Earnings capture is worse than the lack of completeness.
This article originally published on July 13, 2021.
Disclosure: David Trainer, Kyle Guske II, Alex Sword, and Matt Shuler receive no compensation to write about any specific stock, style, or theme.
Follow us on Twitter, Facebook, LinkedIn, and StockTwits for real-time alerts on all our research.
[1] The Journal of Financial Economics proves that only Core Earnings enable investors to overcome the flaws in legacy fundamental data.
[2] The most recent Core Earnings and consensus earnings estimates values are based on the latest audited financial data from calendar 1Q21 10-Qs.
[3] Street Distortion = (consensus earnings estimates – Core EPS)/absolute value of consensus earnings estimates.
[4] While we can explicitly reconcile Core Earnings to GAAP Earnings, we cannot do the same for consensus earnings estimates because analysts do not publicly disclose what is captured in consensus earnings estimates.
[5] For unusual items found only in the latest 10-K, we show the amount applied to TTM calculation and link to the disclosure in the 10-K.
[6] While we can explicitly reconcile Core Earnings to GAAP Earnings, we cannot do the same for consensus earnings estimates because analysts do not publicly disclose what is captured in consensus earnings estimates.
[7] For unusual items found only in the latest 10-K, we show the amount applied to TTM calculation and link to the disclosure in the 10-K.
[8] While we can explicitly reconcile Core Earnings to GAAP Earnings, we cannot do the same for consensus earnings estimates because analysts do not publicly disclose what is captured in consensus earnings estimates.
[9] For unusual items found only in the latest 10-K, we show the amount applied to TTM calculation and link to the disclosure in the 10-K.