
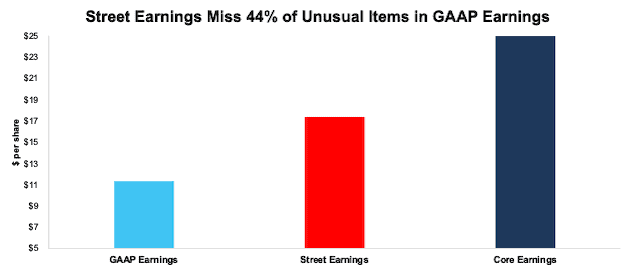
In theory, Wall Street analysts create Street Earnings to adjust GAAP Earnings for unusual gains and losses with the goal of focusing on the true earnings of companies. In reality, Street Earnings rarely, if ever, fully capture these unusual items, which have a very material impact.
As a result, the record earnings beats for 1Q21 are misleading. We expect the same will be true for 2Q21.
Per Figure 1 (from our review of 1Q21 Core Earnings for the S&P 500), Operating Earnings from S&P Global (SPGI) exaggerated the drop and are overstating the rebound in S&P 500 earnings over the last 18 months. The same is true for I/B/E/S Street Earnings for individual companies.
Most investors are not aware that SPGI Operating Earnings and Street Earnings suffer from significant flaws when compared to Core Earnings[1], a better measure of earnings because they exclude material unusual gains/losses missed by Wall Street. Figure 2 lists the companies whose Street Earnings are most misleading.
Figure 1: Core Earnings vs. SPGI Operating Earnings: December 2019 to Present (through 5/19/21[2])
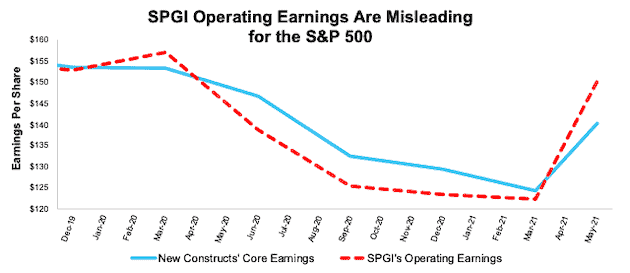
Sources: New Constructs, LLC and company filings.
Ten S&P 500 Companies With the Most Under/Overstated Street Earnings
Figure 2 shows the S&P 500 companies with the most over/understated Street Earnings (in dollar per share) compared to Core Earnings over the trailing twelve months (TTM) through 1Q21[3]. Street Distortion shows the difference between Core Earnings per share and Street Earnings per share.
Figure 2: S&P 500 Companies with Most Under/Overstated Street Earnings: TTM as of 1Q21
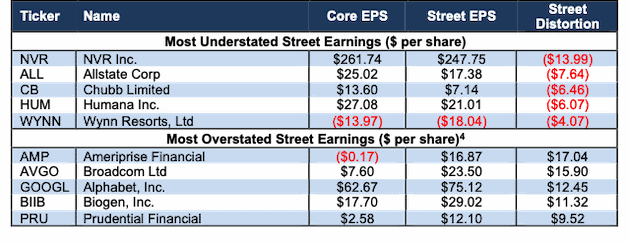
Sources: New Constructs, LLC and company filings.
Below we detail the hidden and reported unusual items that aren’t captured in Street Earnings that are captured in Core Earnings for NVR Inc. (NVR), Allstate (ALL), and Alphabet (GOOGL).
What Causes Differences In Earnings Measures
Many investors know that Generally Accepted Accounting Principles (GAAP) contain numerous loopholes that allow companies to manipulate financial statement disclosures. Fewer investors are aware of how much unusual gains and losses, i.e. unusual items, distort Street Earnings and SPGI’s Operating Earnings.
Many investors assume Street Earnings properly adjust for unusual items, but they do not.
This report details the unusual items missed by Street Earnings. Professors from Harvard Business School and MIT Sloan published similar research in The Journal of Financial Economics, which concludes:
“Street Earnings adjustments are not necessarily complete or comparable across firms."
(Page 16, 3rd paragraph)
NVR’s TTM 1Q21 Street Earnings Understated by $13.99/share
The Street Distortion, or difference between NVR’s Street Earnings ($274.75/share) and Core Earnings ($261.74/share), is -$13.99/share. NVR’s GAAP Earnings are $261.74/share, so the GAAP Distortion, or difference between reported GAAP Earnings and Core Earnings, is $13.43/share, which is $0.56/share less than Street Distortion. In other words, Street Distortion is worse than GAAP Distortion, and Street Earnings are more understated than GAAP Earnings.
Figure 3: Comparing NVR’s Core, Street, and GAAP Earnings: TTM as of 1Q21
Sources: New Constructs, LLC and company filings.
Since Street Distortion and GAAP Distortion are about the same, it is clear that Street Earnings are not adding a lot of value by removing the unusual expenses that materially distort GAAP Earnings. Below, we detail the differences between Core Earnings and GAAP Earnings so readers can audit our research.
Figure 4: NVR GAAP Earnings to Core Earnings Reconciliation

Sources: New Constructs, LLC and company filings.
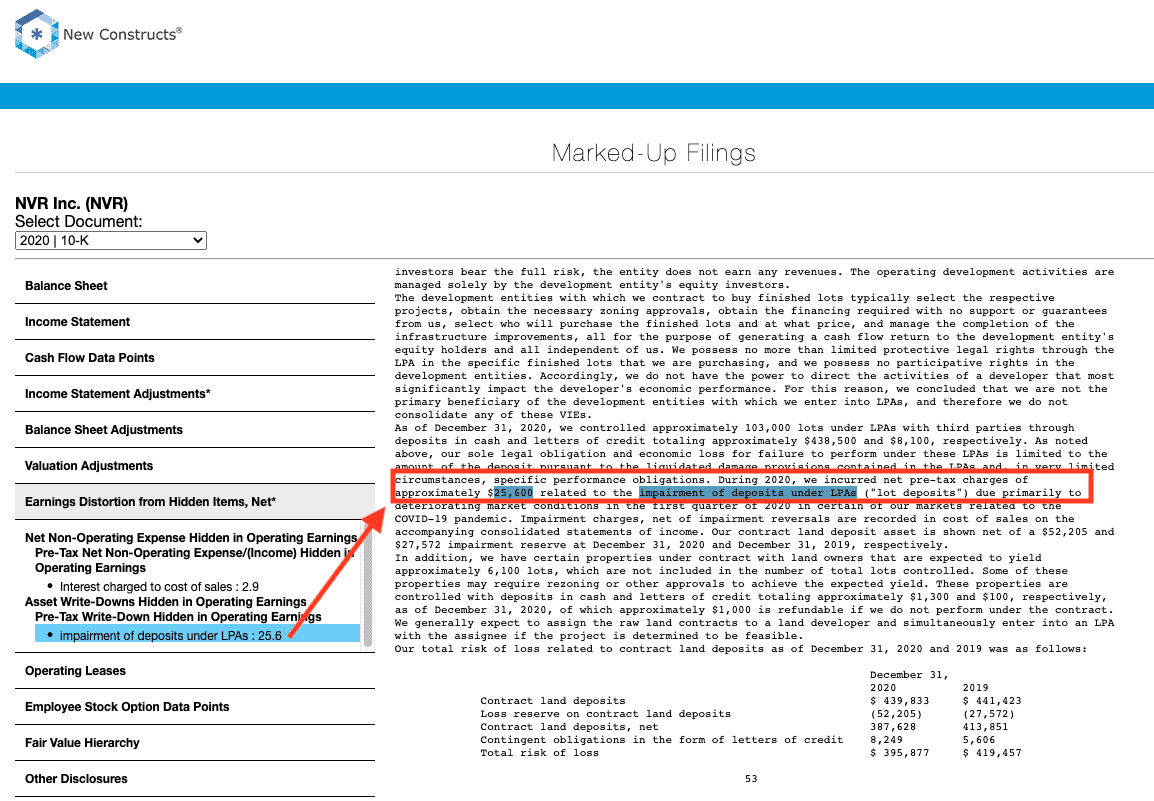
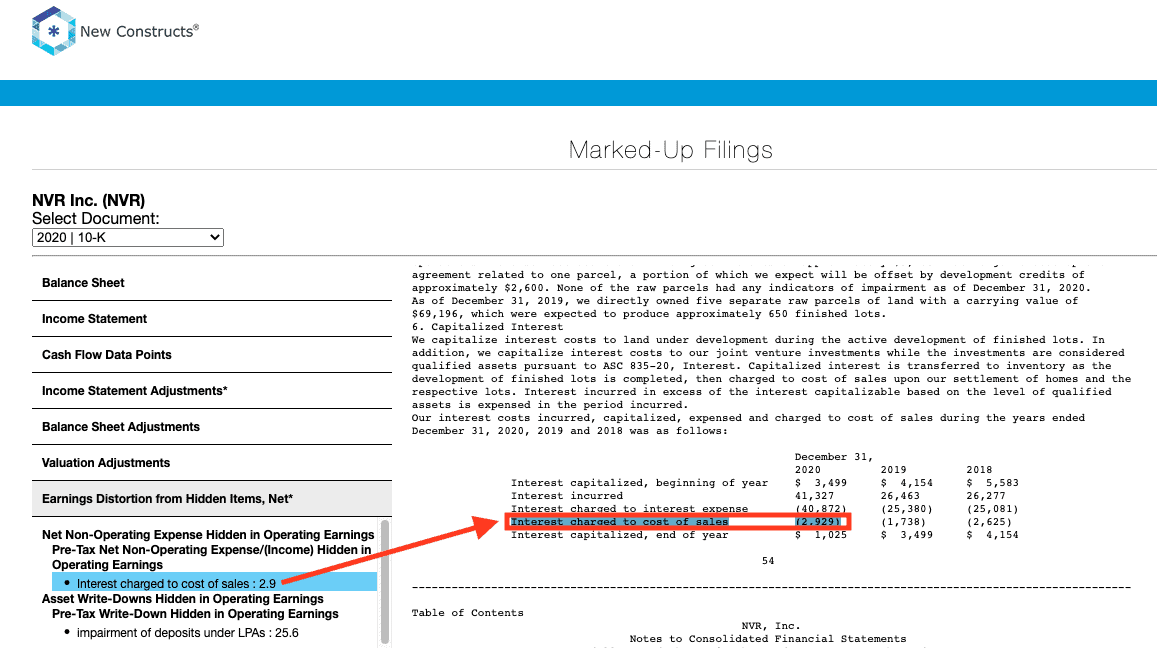
Hidden Unusual Expenses, Net = -$22 million or -$5.51/per share
- -$0.2 million in the TTM for capitalized interest charged to cost of sales – Page 7 1Q21 10-Q
- -$19.2 million in the TTM period based on $25.6 million of impairment of lot deposits due to deteriorating market conditions – Page 53 2020 10-K
- -$2.2 million in the TTM period based on $2.9 million of capitalized interest charged to cost of sales – Page 54 2020 10-K
Tax Distortion = -$31 million or -$7.92/per share
- We remove the tax impact of unusual items on reported taxes when we calculate Core Earnings. It is important that taxes get adjusted so they are appropriate for adjusted pre-tax earnings.
Allstate’s TTM 1Q21 Street Earnings Understated by $7.64/share
The Street Distortion in Allstate’s 1Q21 TTM earnings is -$7.64/share, which is 44% less the -$13.65/share in GAAP Distortion. Street Earnings do a better job of capturing unusual items for Allstate than NVR, but they still miss 44% of the unusual items in GAAP Earnings.
Figure 5: Comparing Allstate’s Core, Street, and GAAP Earnings: TTM as of 1Q21
Sources: New Constructs, LLC and company filings.
Below, we detail the differences between Core Earnings and GAAP Earnings so readers can audit our work.
Figure 6: Allstate GAAP Earnings to Core Earnings Reconciliation

Sources: New Constructs, LLC and company filings.
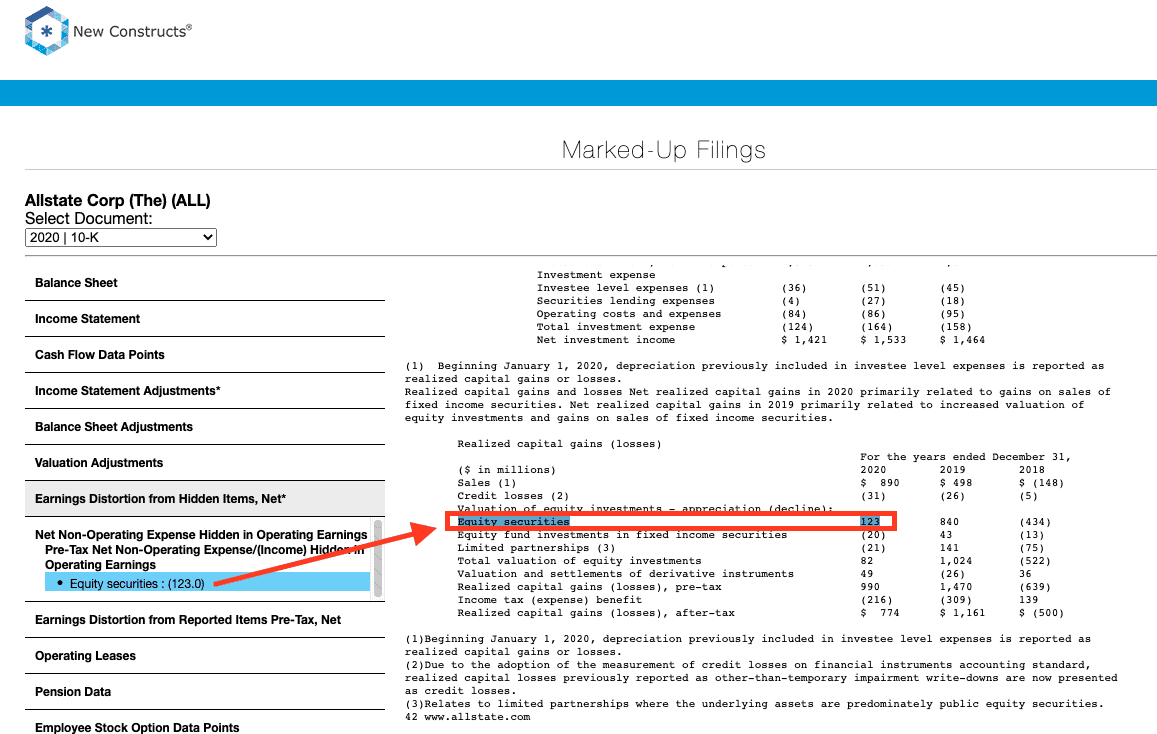
Hidden Unusual Gains, Net = $92 million or $0.30/per share
- $92 million in the TTM period based on $123 million in realized capital gains – Page 42 2020 10-K
Reported Unusual Expenses Pre-Tax, Net = -$629 million or -$2.02/per share
- -$738 million for Shelter-in-Place Payback expenses – 2Q20 10-Q
- $679 million for pension and other postretirement remeasurement gains in the TTM period, based on
- -$73 million loss in 2Q20
- $71 million gain in 3Q20
- $371 million gain in 4Q20
- $310 million gain in 1Q21
- -$305 million in restructuring and related charges in the TTM period, based on
- -$14 million in 2Q20
- -$200 million in 3Q20
- -$40 million in 4Q20
- -$51 million in 1Q21
- $268 million contra adjustment for recurring pension costs. These recurring expenses are reported in non-recurring line items, so we add them back and exclude them from Earnings Distortion.
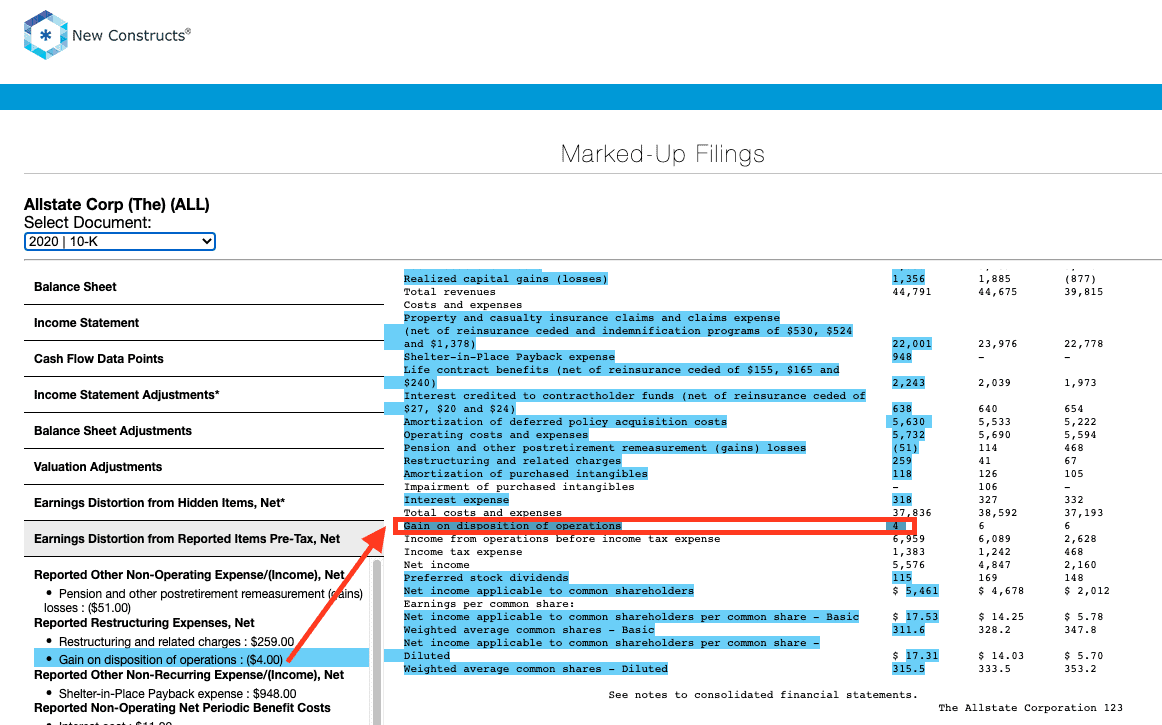
- $3 million gain in the TTM period based on a $4 million gain on disposition of operations – 2020 10-K
Reported Unusual Expenses After-Tax, Net = -$3.8 billion or -$12.18/per share
- -$3.8 billion loss from discontinued operations – 1Q21 10-Q
Tax Distortion = $77 million or $0.25/per share
- We remove the tax impact of unusual items on reported taxes when we calculate Core Earnings. It is important that taxes get adjusted so they are appropriate for adjusted pre-tax earnings.
While the NVR example shows how Street Earnings miss hidden items, our research shows Allstate’s Street Earnings fail to capture a very material amount of unusual items reported directly on the income statement.
Alphabet’s TTM 1Q21 Street Earnings Overstated by $12.45/share
The Street Distortion in Alphabet’s 1Q21 TTM earnings is $12.45/share, which is $.08/share (1%) more than GAAP Distortion. Alphabet’s GAAP Earnings are $75.04/share, so the “GAAP Distortion” is $12.37/share, or just $0.08/share less than the Street Distortion.
In other words, Street Distortion is actually worse than GAAP Distortion, and Street Earnings are more overstated than GAAP Earnings.
Figure 7: Comparing Alphabet’s Core, Street, and GAAP Earnings: TTM as of 1Q21
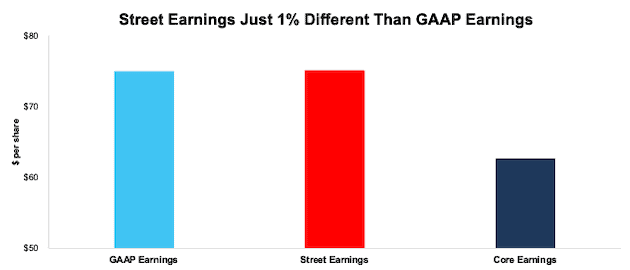
Sources: New Constructs, LLC and company filings.
Below, we detail the differences between Core Earnings and GAAP Earnings so readers can audit our work.
Figure 8: Alphabet GAAP Earnings to Core Earnings Reconciliation

Sources: New Constructs, LLC and company filings.
The majority, $8.63/share, of the unusual income that Street Earnings fail to capture is very clearly non-core and appears below the “Income From Operations” line of Alphabet’s income statement in both the 1Q21 10-Q and 2020 10-K.
Reported Unusual Gains, Net = $10.2 billion or $14.84/per share
- Each of the following is included in Other income (expense) on the income statement. We found these details in the footnotes:
- $7.6 billion gain on debt & equity securities in the TTM period, based on
- $1.5 billion gain on equity securities in 2Q20
- $387 million gain on debt securities in 2Q20
- $1.9 billion gain on equity securities in 3Q20
- $116 million gain on debt securities in 3Q20
- -$991 million loss on equity and debt securities in 4Q20
- $4.8 billion gain on equity securities in 1Q21
- -$86 million loss on debt securities in 1Q21
- -$1.3 billion in performance fees in the TTM period, based on
- -$75 million in 2Q20
- -$135 million in 3Q20
- -$405 million in 4Q20
- -$665 million in 1Q21
- -$282 million in Other Expense (income) in the TTM period, based on
- -$147 million expense in 2Q20
- -$88 million expense in 3Q20
- -$420 million expense in 4Q20
- $373 million income in 1Q21
- -$150 million in foreign currency exchange losses in the TTM period, based on
- -$92 million loss in 2Q20
- -$84 million loss in 3Q20
- -$87 million loss in 4Q20
- $113 million gain in 1Q21
- $7.6 billion gain on debt & equity securities in the TTM period, based on
- $4.3 billion or $6.28/per share in the TTM period based on a $4.3 billion unrealized gain on equity securities – 2020 10-K
Tax Distortion = -$1.7 billion or -$2.47/per share
- We remove the tax impact of unusual items on reported taxes when we calculate Core Earnings. It is important that taxes get adjusted so they are appropriate for adjusted pre-tax earnings.
Conclusion: Core Earnings Are More Reliable
As demonstrated above, Core Earnings do a better job of excluding unusual gains and losses and provide a more reliable earnings measure. All Core Earnings adjustments to GAAP Earnings are 100% transparent; so users can audit and trust the research.
A lack of transparency into exactly what makes up Street Earnings and SPGI’s Operating Earnings undermines investors’ ability to analyze profitability. In theory, the differences between Core Earnings and GAAP Earnings should be captured in Street Earnings and SPGI’s Operating Earnings. In theory, they adjust GAAP Earnings for both reported and hidden unusual items. In reality, they do not consistently adjust for unusual items.
For many investors, especially quants, the lack of consistency in what Street Earnings and SPGI’s Operating Earnings capture is worse than the lack of completeness.
Check out this week’s Danger Zone interview with Chuck Jaffe of Money Life.
This article originally published on June 15, 2021.
Disclosure: David Trainer, Kyle Guske II, Alex Sword, and Matt Shuler receive no compensation to write about any specific stock, style, or theme.
Follow us on Twitter, Facebook, LinkedIn, and StockTwits for real-time alerts on all our research.
[1]As proven in Core Earnings: New Data & Evidence, a paper in The Journal of Financial Economics, only Core Earnings enable investors to overcome the flaws in legacy fundamental data and research.
[2] The earliest date that the 1Q21 10-Qs for all S&P 500 constituents were available.
[3] The most recent Core Earnings and Street Earnings values are based on the latest audited financial data from calendar 1Q21 10-Qs.
[4] We exclude Berkshire Hathaway (BRK.A) because the majority of distortion comes from the well-known unrealized gains on equity securities. For more details, see our recent report: The Most Overstated & Understated Earnings in the S&P 500 Post 1Q21 Earnings
[5] While we can explicitly reconcile Core Earnings to GAAP Earnings, we cannot do the same for Street Earnings because analysts do not publicly disclose what is captured in Street Earnings.
[6] For unusual items found only in the latest 10-K, we show the amount applied to TTM calculation and link to the disclosure in the 10-K.
[7] While we can explicitly reconcile Core Earnings to GAAP Earnings, we cannot do the same for Street Earnings because analysts do not publicly disclose what is captured in Street Earnings.
[8] For unusual items found only in the latest 10-K, we show the amount applied to our TTM calculation and link to the disclosure in the 10-K.
[9] While we can explicitly reconcile Core Earnings to GAAP Earnings, we cannot do the same for Street Earnings because analysts do not publicly disclose what is captured in Street Earnings.
[10] For unusual items found only in the latest 10-K, we show the amount applied to TTM calculation and link to the disclosure in the 10-K.